

Answered step by step
Verified Expert Solution
Question
1 Approved Answer
Hello, Can somebody help me with this? Thanks! Choose 18 companies traded on the NYSE. For each stock, find the monthly closing prices for 61
Hello, Can somebody help me with this?
Thanks!
- Choose 18 companies traded on the NYSE.
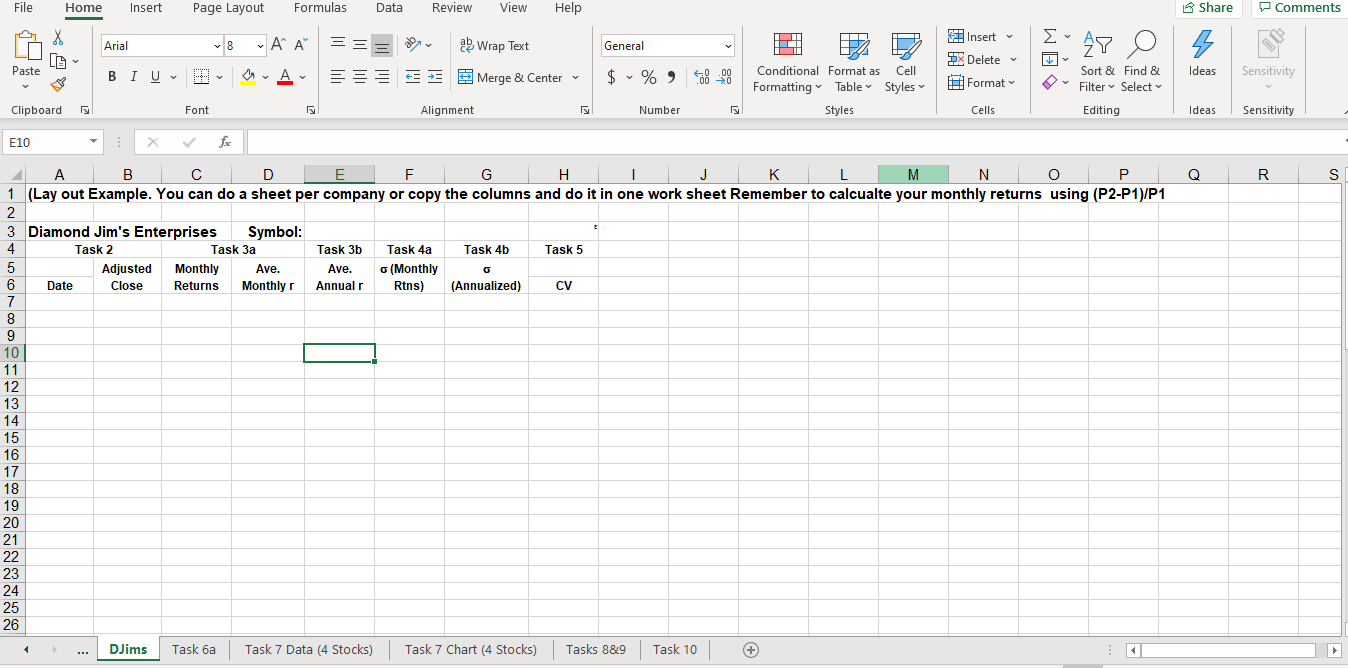
- For each stock, find the monthly closing prices for 61 months. The ending date will be the beginning of this month of this year and the beginning of the period will be 61 months ago.. These data are easily found at Yahoo! Finance . In Yahoo Finance enter a companys stock symbol in the search field. Once you arrive at the companys Summary page, click on the Historical Data link. Enter the required date range (Your 61 months) and ensure that you have selected monthly then click on Apply. Click on Download Data. Copy and paste information in the Date and Adj. Close columns into the appropriate columns on the worksheet in the workbook I have provided you (see Format below). When you paste, chose the 123 option. The other data columns are not needed]. Sort these data from oldest to newest. Ensure that you provide the name of the company and its stock symbol in the appropriate cells at the top of the worksheet.
- Find the average realized rate of rate of return (rs) over 60 months for each stock. (That is why you need 61 monthly stock prices) Do this by computing the realized return for each month then finding the average of all 60 monthly returns. The return for each month is found by using the equation: (Ending Price Beginning Price) / Beginning Price.
- Translate the average monthly realized return to an annualized realized return by multiplying the number you arrived at in part a. by 12.
- Find the standard deviation (s) for the 60 monthly realized returns. Use the standard deviation function to do this.
- Translate this number into an annualized standard deviation by multiplying it by the square root of 12 (use the SQRT function).
- Compute the coefficient of variation for each stock using average annualized realized returns from 3b. and the annualized ss from 4b. above.
Step by Step Solution
There are 3 Steps involved in it
Step: 1

Get Instant Access to Expert-Tailored Solutions
See step-by-step solutions with expert insights and AI powered tools for academic success
Step: 2

Step: 3
Ace Your Homework with AI
Get the answers you need in no time with our AI-driven, step-by-step assistance
Get Started
Supply Chain Cost Control Using Activity Based Management
Authors: Sameer Kumar, Matthew Zander
1st Edition
0849382157, 9780849382154