

Question
Hello, can someone help review this for me? These are my responses but I wanted to make sure I wasn't incorrect or missing anything? The
Hello, can someone help review this for me? These are my responses but I wanted to make sure I wasn't incorrect or missing anything?
The link are the homes for the pacific region:
https://documentcloud.adobe.com/link/review?uri=urn:aaid:scds:US:8aca59d8-157b-46a6-924c-e84359cc9e2a
Introduction
I have been hired by the Regional Real Estate Company to help them analyze real estate data. One of the company's Pacific region sales people just returned to the office with a newly designed advertisement. It states that the average cost per square foot of his home sales is above the average cost per square foot in the Pacific region. They would like for me to make sure that he can make that statement before approving the use of the advertisement. The average cost per square foot of his home sales is $275. To test his claim, I have collected a sample of 1,001 home sales for the Pacific region to analyze.
Setup
Define your population parameter: The average cost per square foot of salesperson's home sales. Remember, the salesperson believes that his sales are higher. Ho : ? ? 275 Ha : ?
Data Analysis Preparations
This is a case of One Sample t-Test because it compares the sample to the population and because we are assuming that the salesperson believes that his sales are higher, we do the one-tailed test instead of two. For us to know, we define the necessary parameters first. So, the parameter that we need first is the hypothesized population mean and the standard deviation. For us to know that, we get the average cost per square foot of all home sales and then get their standard deviation. Using MS Excel, the average cost square per foot of home sales is $264.01with a standard deviation of $161.74. Now we can state the null and alternate hypothesis: H0= The average cost per square foot of all home sales is greater than or equal to $275. H1= The average cost per square foot of all home sales is less than $275.This situation is tricky, so we are treating $275 as population mean because this is the only variable stated that does not consist of a sample. Otherwise, we will have problem as we do not know all the average home sales. The test that we will be doing isOne Sample t-Test. Since we believed that his sales are higher, we will do theleft tailed test. It makes sense if we look at the numerator of the formula that if x? is less than ?0, then we will have negative value. The significance level is said to be0.05.
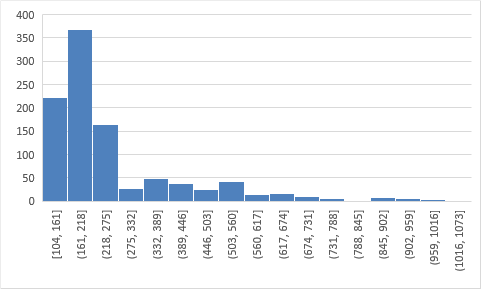
If we look at the shape of the histogram, it is skewed to the right. It is also shown by the fact that the skewness is greater than 0.5, which is interpreted as symmetrical. The data is so much peaked. There is only a certain small region in the histogram that has much greater area than the rest of the histogram. This implies that the among the average cost per square foot of home sales, the most affordable ones have the highest frequency and the most expensive has extremely small frequency. The distribution of the data, despite being large, is not normal. It is peaked, and it is skewed. The centermost of the data is not on the center of the histogram. With this being said, it is not then appropriate to use one-sample t-test. However, we can use a nonparametric test correspondent to this.We call that one sample sign test.
Calculations
Calculate thepvalue.
Using excel to get the p-value :
=T.DIST(-2.14917, 1000, 1)
Output p-value :
p-value = 0.015930185
Next is to compare the p-value to the significance level, ? = 0.05
p-value = 0.015930185
The claim of the salesperson is false since the p-value = 0.015930185
Test Decision
Basically, the p value measures the probability of getting extreme values that are possible sources of deviations and errors. The significance level is the probability of rejecting the null hypothesis when it is true. Therefore, when relating the two values, it would give you a hint on how you would proceed with your hypothesis testing as they give an accurate decision-making variable to consider.If the p value > significance level, ? : Fail to reject the null hypothesis If the p value
Conclusion
In Conclusion, after collecting a sample of 1,001 home sales for the Pacific region to analyze and test my test decisions support my hypothesis. After determining the data analysis preparations, the significance level helped establish the appropriate test statistic, then calculate the statistics to prove they are significant results. From the provided solutions, the claim of the salesperson is false since the p-value = 0.015930185
Rubric:
- Setup:Define your population parameter, including hypothesis statements, and specify the appropriate test.
- Define your population parameter.
- Write the null and alternative hypotheses. Note: Remember, the salesperson believes that his sales are higher.
- Specify the name of the test you will use.
- Identify whether it is a left-tailed, right-tailed, or two-tailed test.
- Identify your significance level.
- Data Analysis Preparations:Describe sample summary statistics, provide a histogram and summary, check assumptions, and find the test statistic and significance level.
- Provide the descriptive statistics (sample size, mean, median, and standard deviation).
- Provide a histogram of your sample.
- Describe your sample by writing a sentence describing the shape, center, and spread of your sample.
- Determine whether the conditions to perform your identified test have been met.
- Calculations:Calculate the p value, describe the p value and test statistic in regard to the normal curve graph, discuss how the p value relates to the significance level, and compare the p value to the significance level to reject or fail to reject the null hypothesis.
- Determine the appropriate test statistic, then calculate the test statistic.
- Note:This calculation is (mean - target)/standard error. In this case, the mean is your regional mean (Pacific), and the target is 275.
- Calculate thepvalue.
- Note:For right-tailed, use the T.DIST.RT function in Excel, left-tailed is the T.DIST function, and two-tailed is the T.DIST.2T function. The degree of freedom is calculated by subtracting 1 from your sample size.
- Choose your test from the following:
- =T.DIST.RT([test statistic], [degree of freedom])
- =T.DIST([test statistic], [degree of freedom], 1)
- =T.DIST.2T([test statistic], [degree of freedom])
- Using the normal curve graph as a reference, describe where the p value and test statistic would be placed.
- Test Decision:Discuss the relationship between the p value and the significance level, including a comparison between the two, and decide to reject or fail to reject the null hypothesis.
- Discuss how thepvalue relates to the significance level.
- Compare thepvalue and significance level, and make a decision to reject or fail to reject the null hypothesis.
- Conclusion:Discuss how your test relates to the hypothesis and discuss the statistical significance.
- Explain in one paragraph how your test decision relates to your hypothesis and whether your conclusions are statistically significant.
Step by Step Solution
There are 3 Steps involved in it
Step: 1

Get Instant Access to Expert-Tailored Solutions
See step-by-step solutions with expert insights and AI powered tools for academic success
Step: 2

Step: 3
Ace Your Homework with AI
Get the answers you need in no time with our AI-driven, step-by-step assistance
Get Started
Basic College Mathematics (Subscription)
Authors: Elayn Martin Gay
6th Edition
0134844947, 9780134844947