Hello,,,
Can you answer them?
Thank you
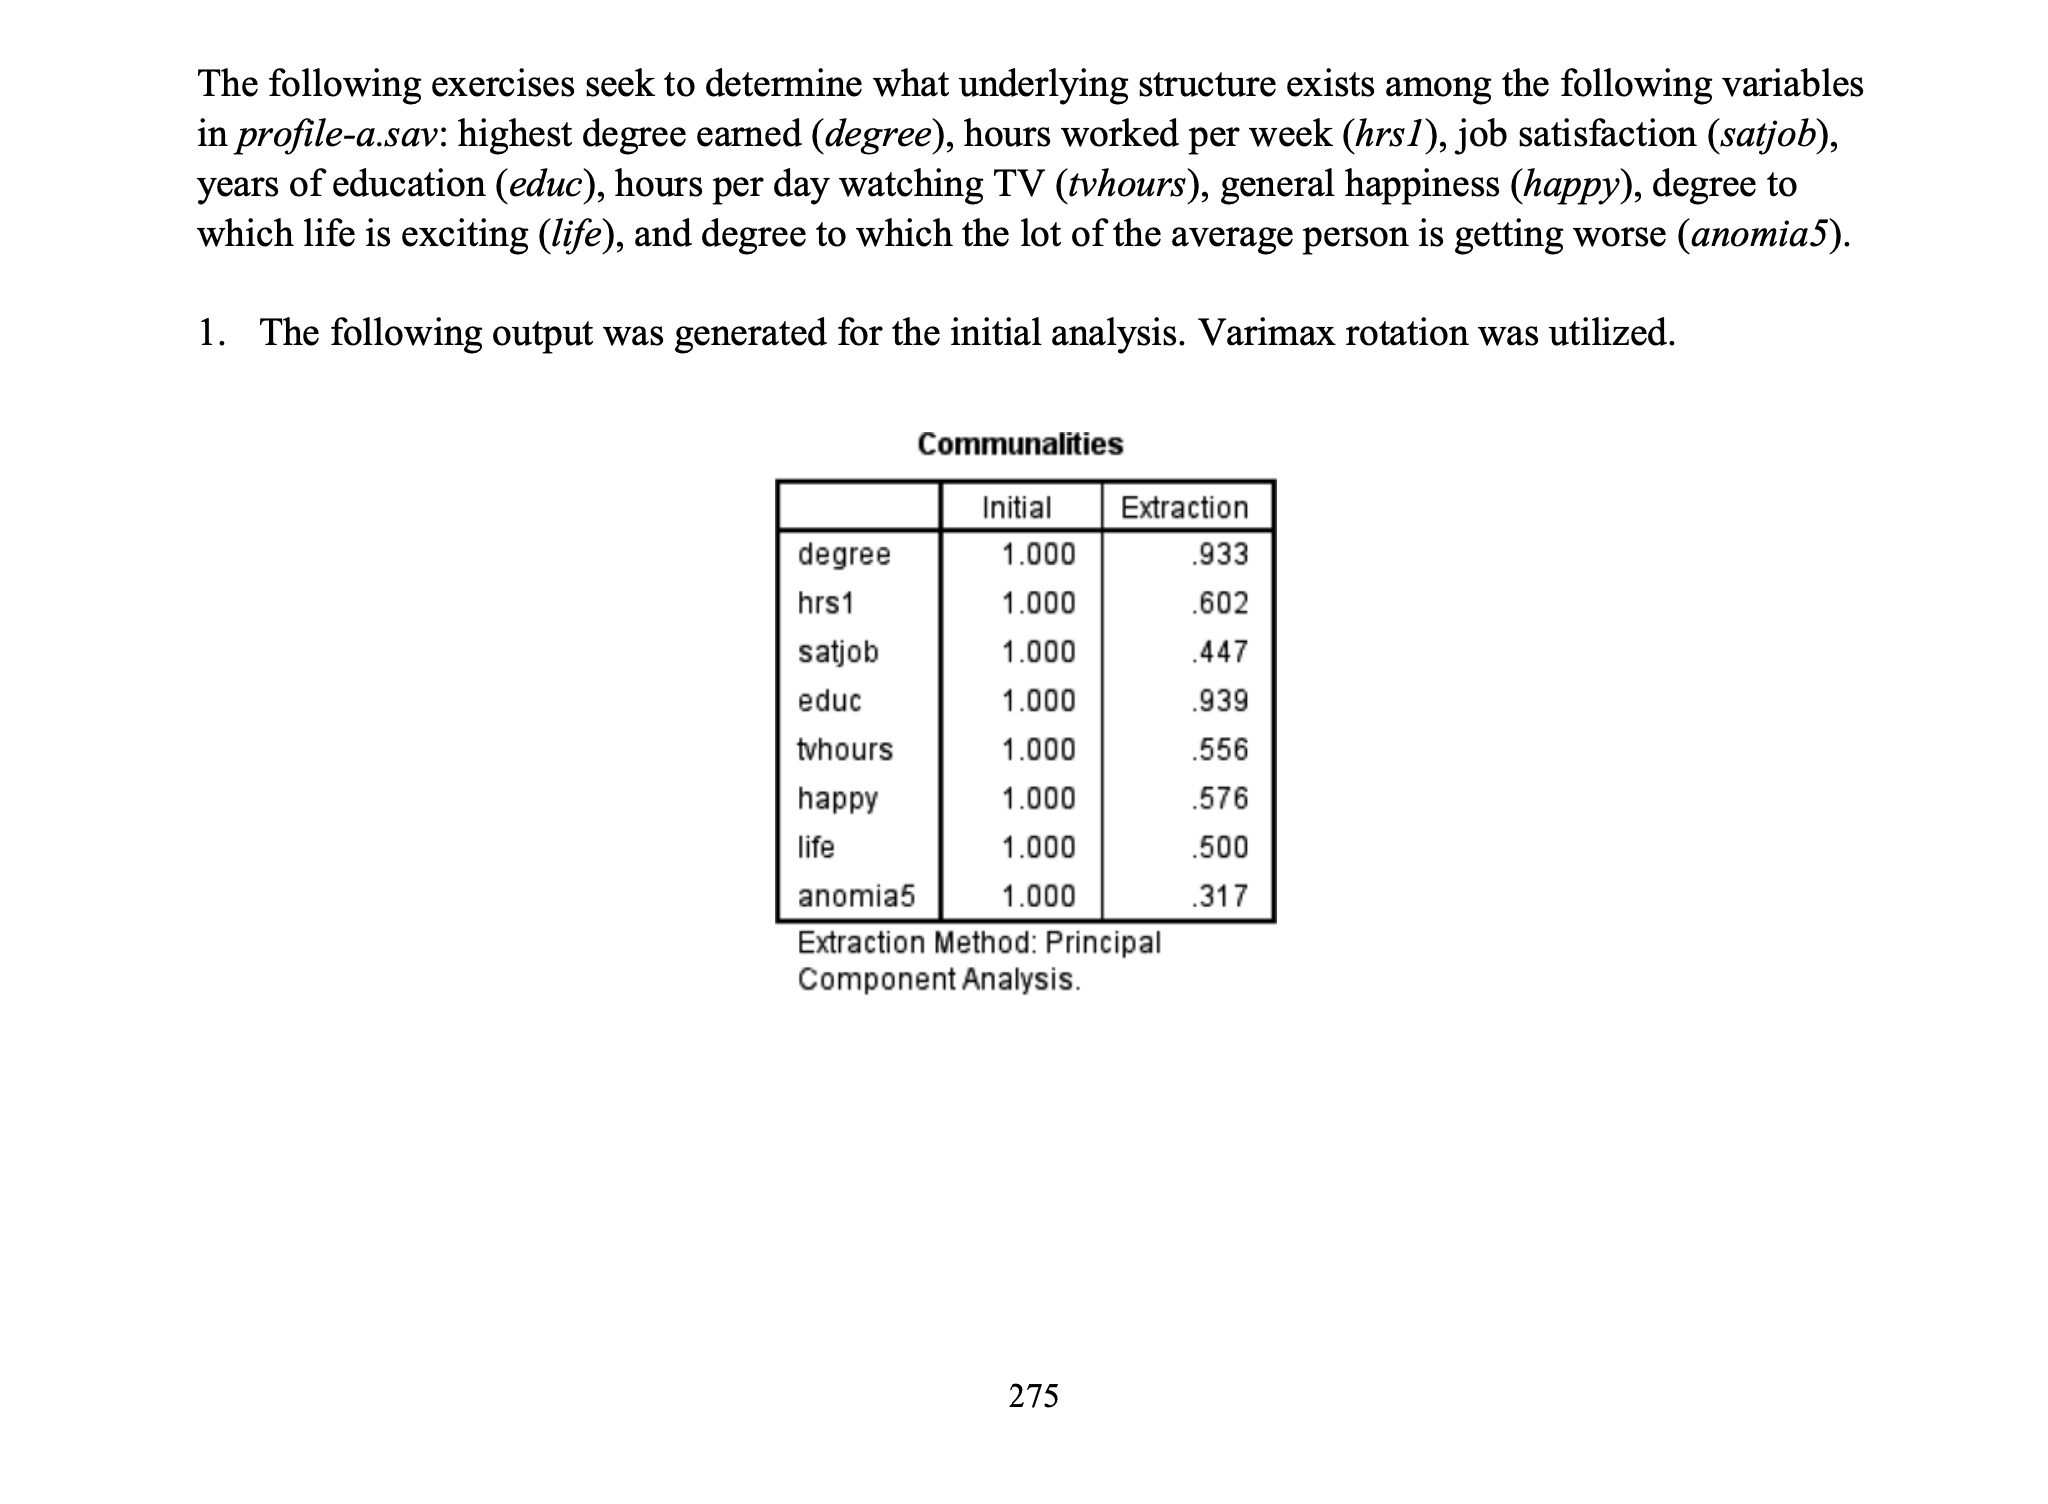
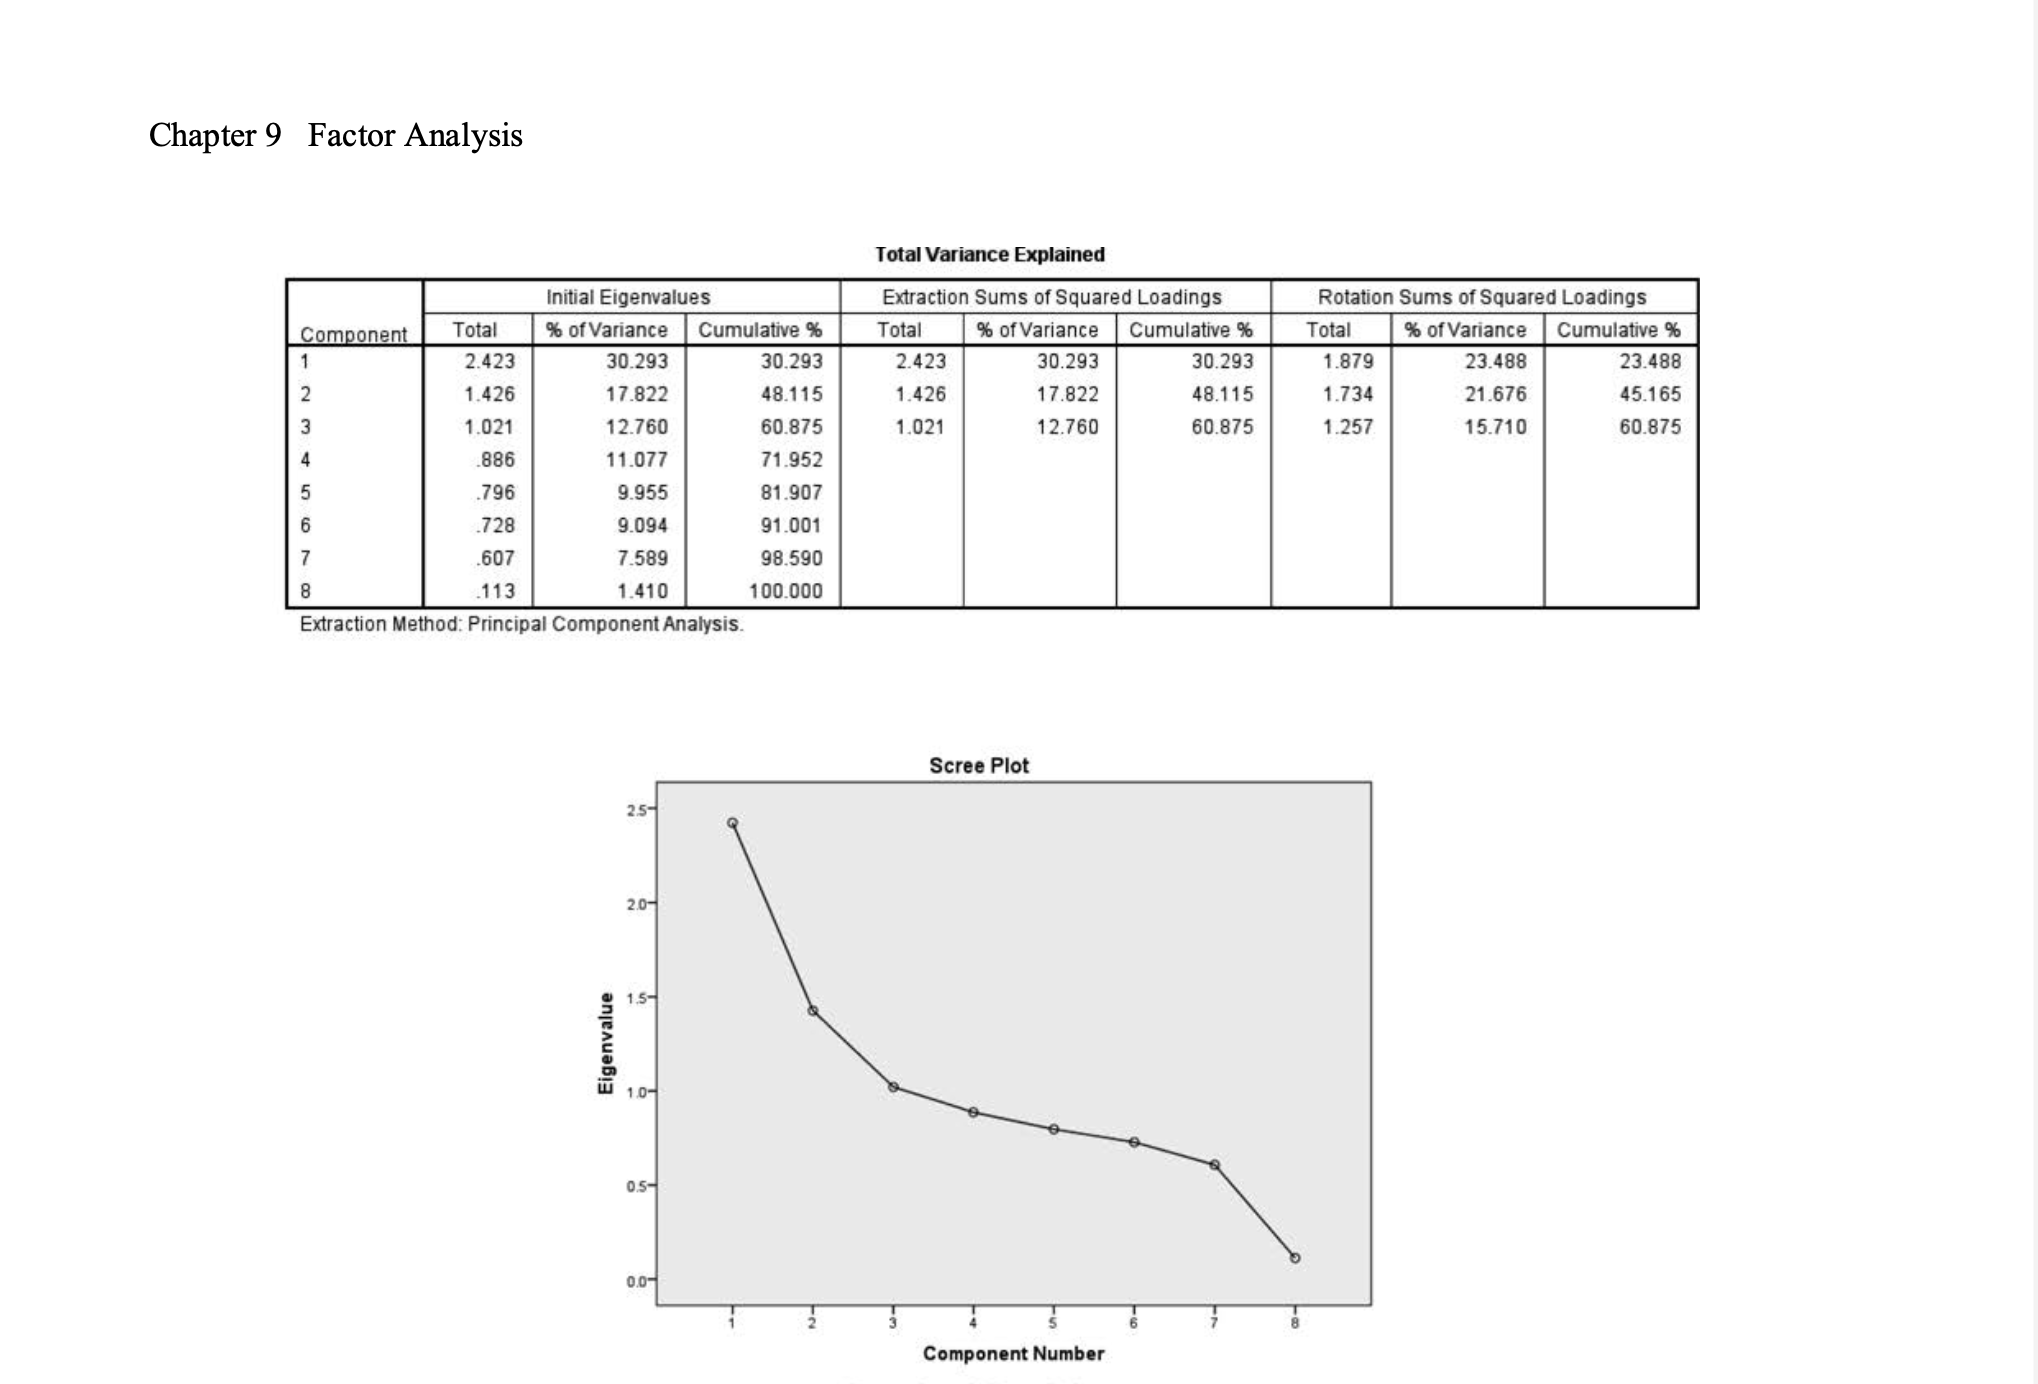
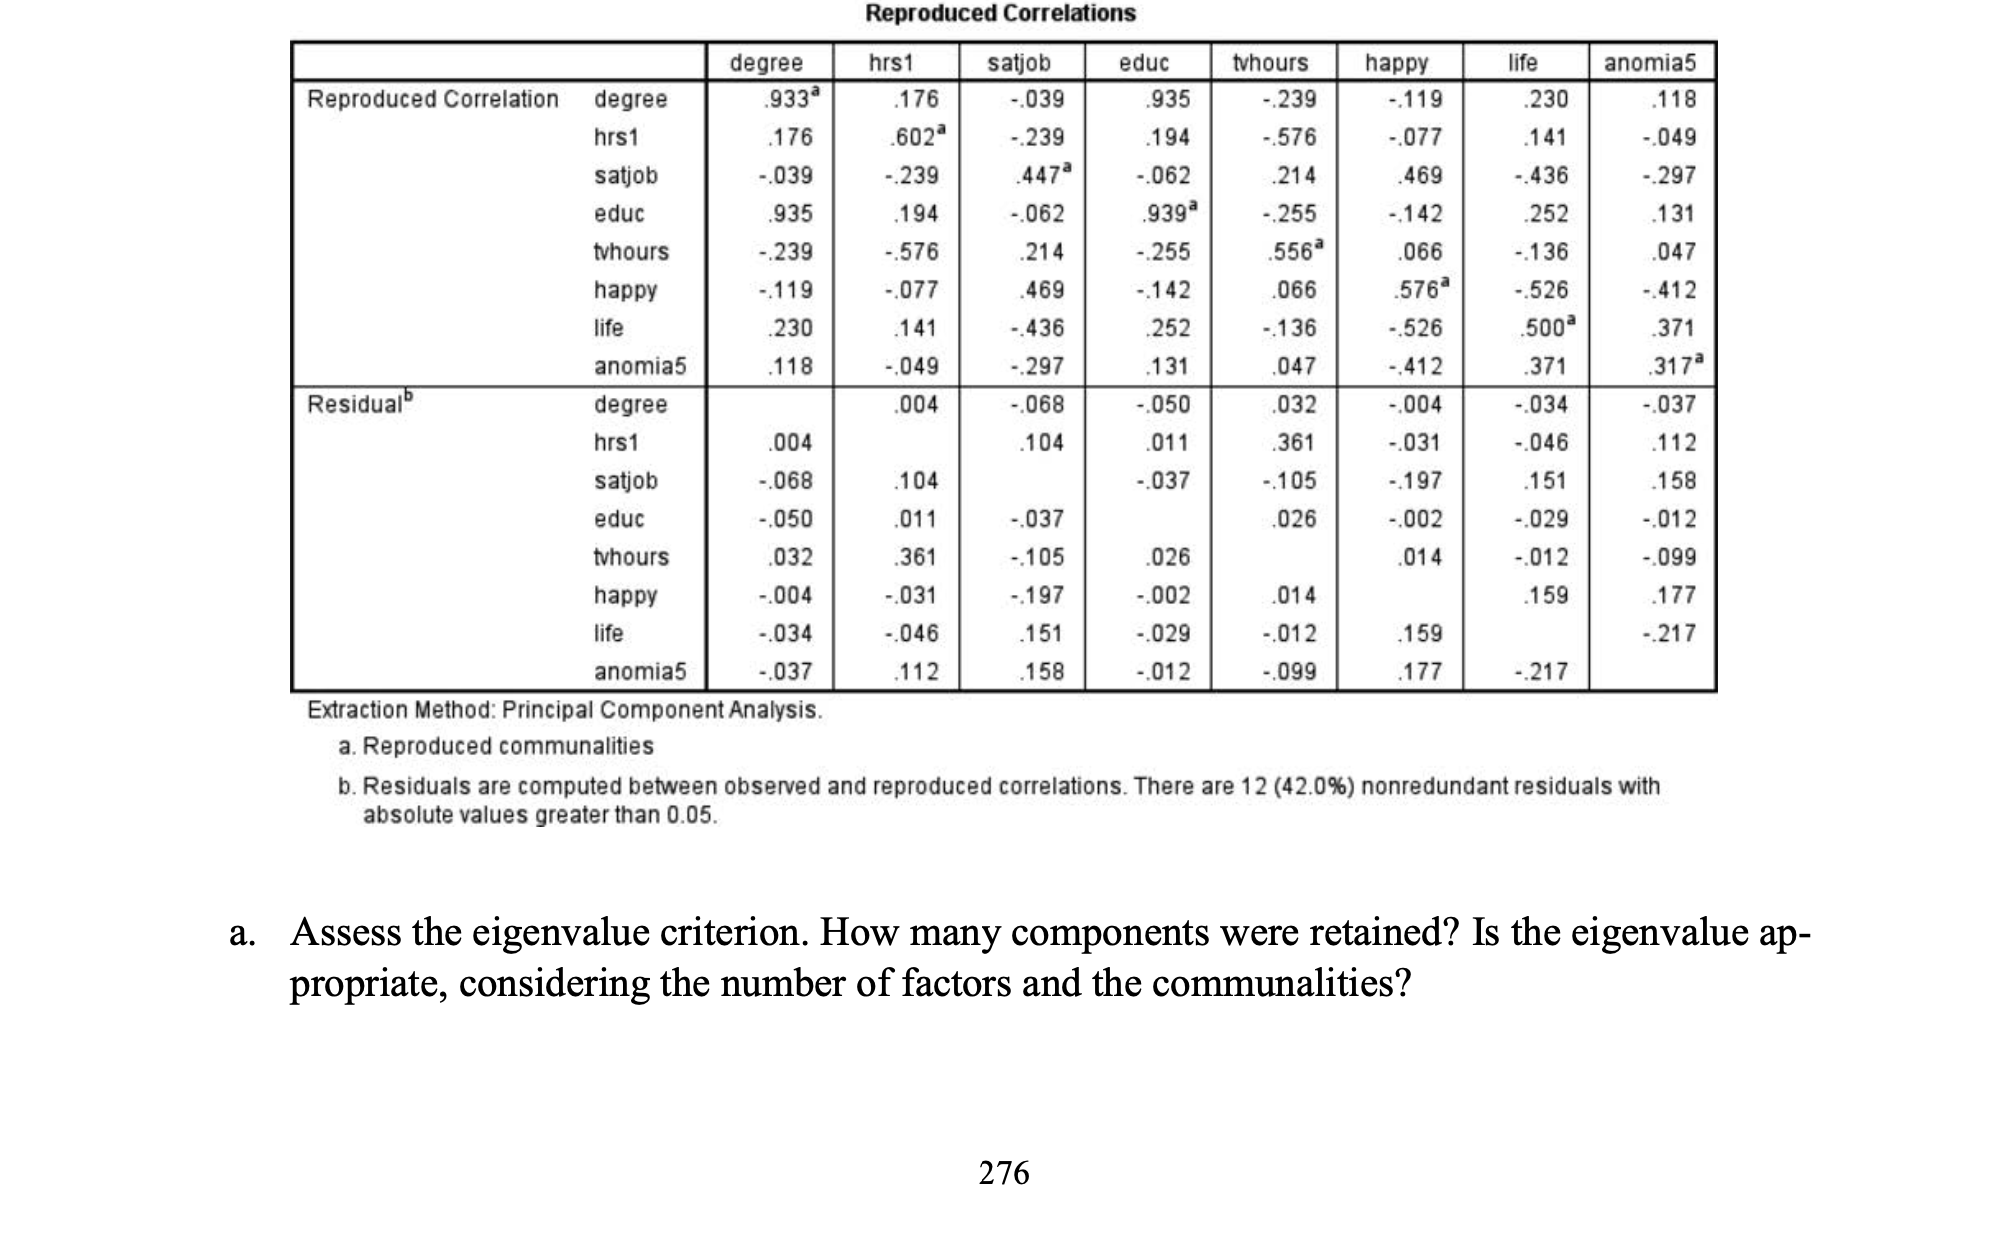
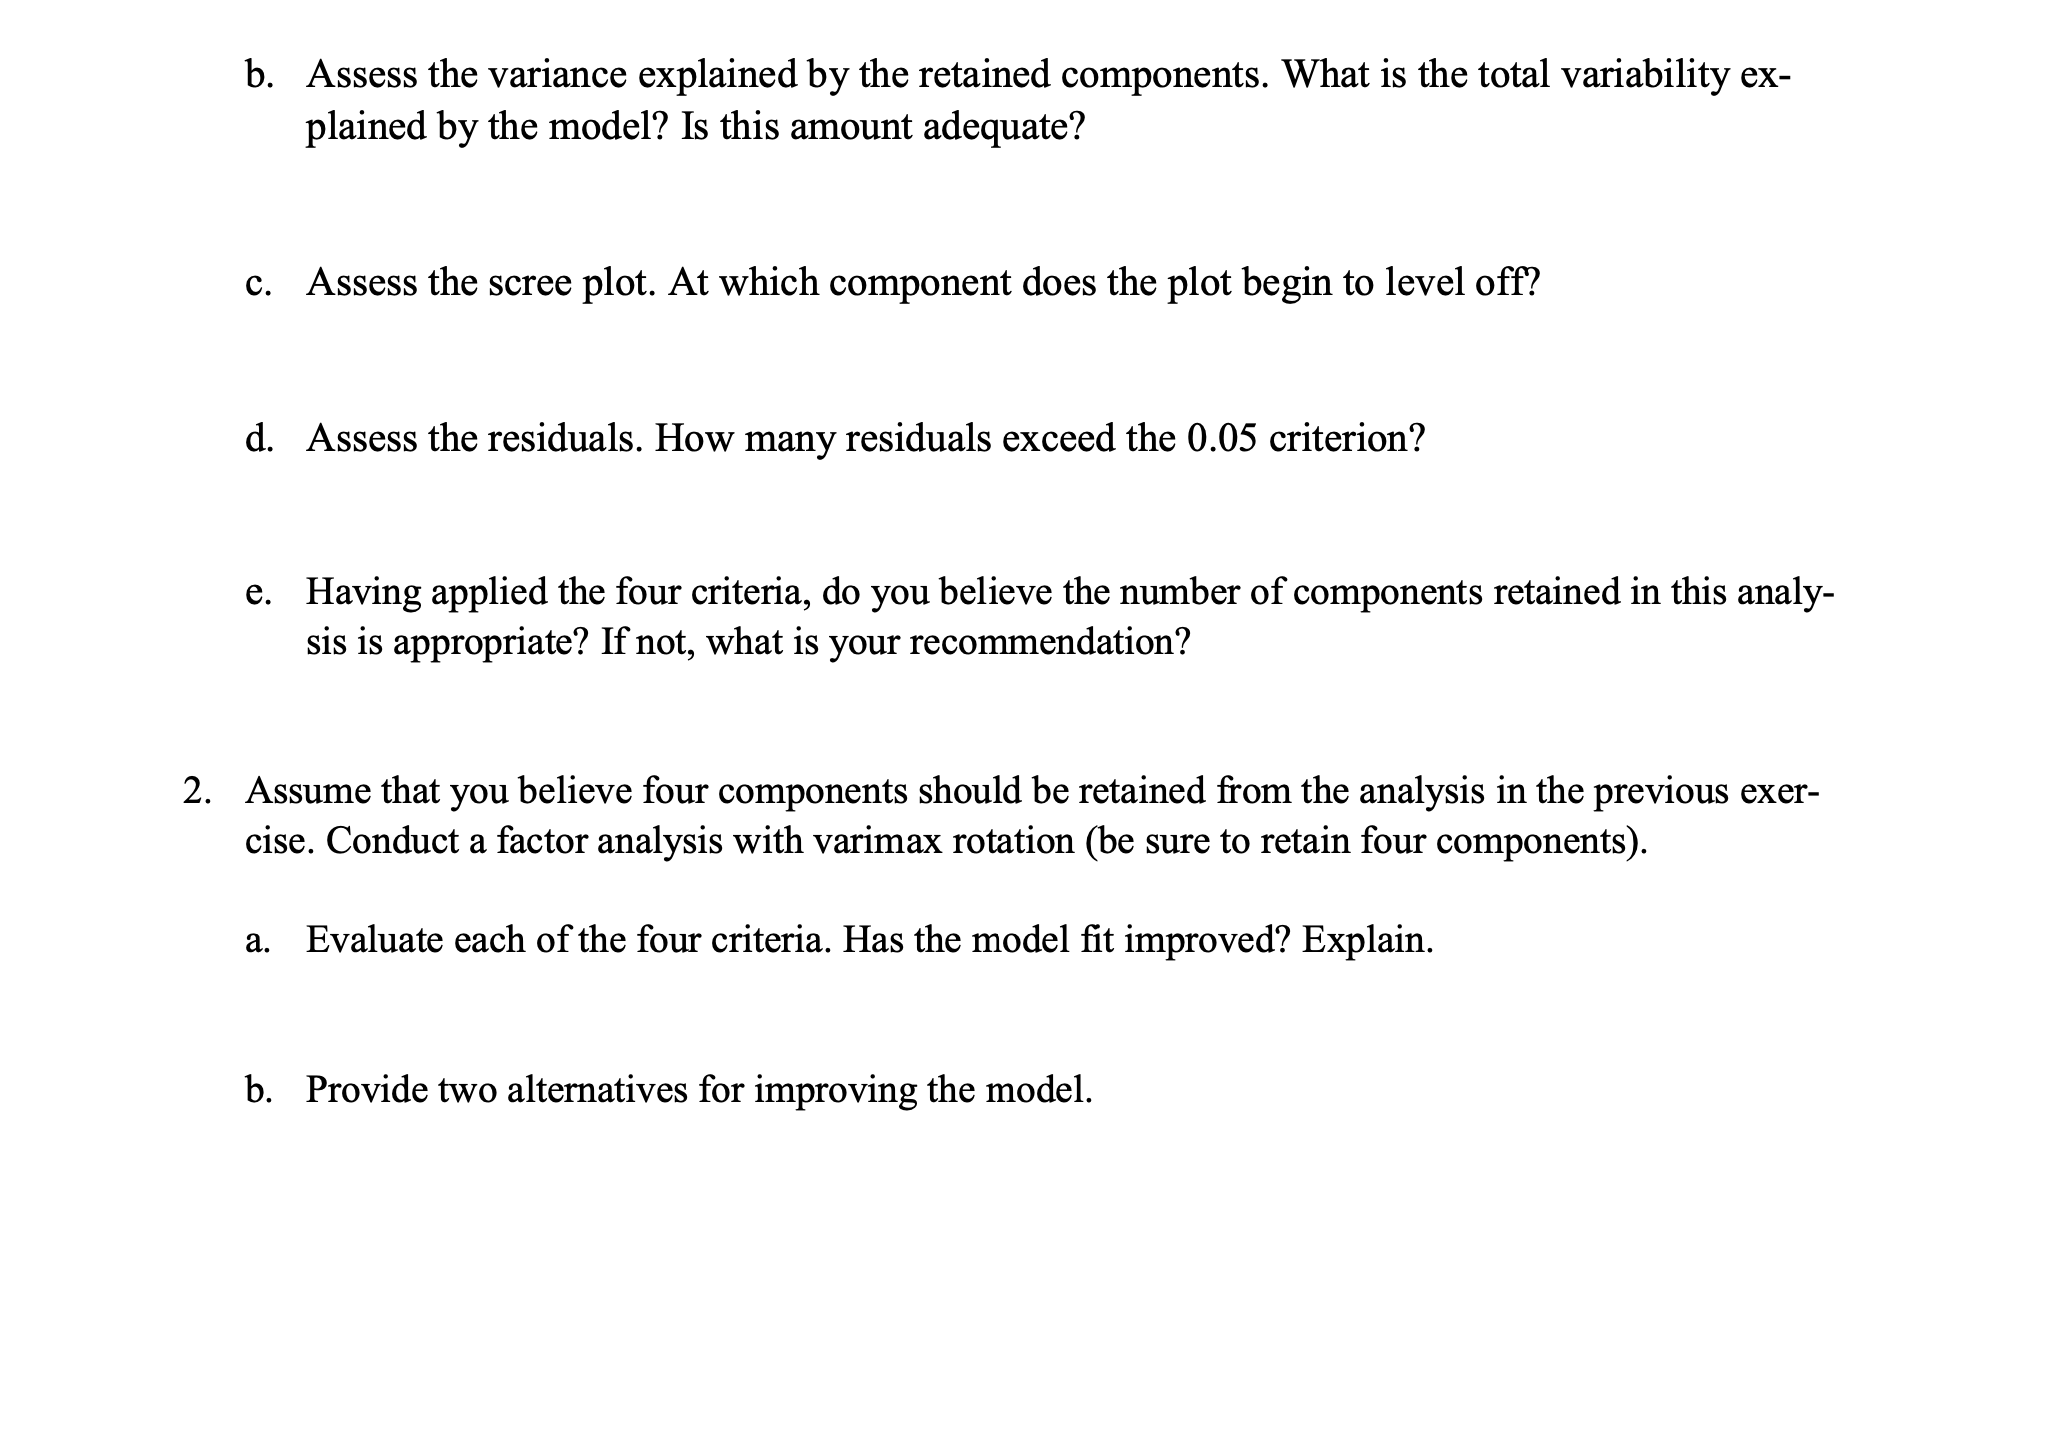
The following exercises seek to determine what underlying structure exists among the following variables in profile-a.sav: highest degree earned (degree), hours worked per week (hrs]), job satisfaction (satjob), years of education (educ), hours per day watching TV (tvhours), general happiness (happy), degree to which life is exciting (life), and degree to which the lot of the average person is getting worse (anomia5). 1. The following output was generated for the initial analysis. Varimax rotation was utilized. Communalities Initial Extraction degree 1.000 933 hrs 1 1.000 602 satjob 1.000 447 educ 1.000 939 tvhours 1.000 556 happy 1.000 576 life 1.000 .500 anomia5 1.000 .317 Extraction Method: Principal Component Analysis. 275Chapter 9 Factor Analysis Total Variance Explained Initial Eigenvalues Extraction Sums of Squared Loading Rotation Sums of Squared Loadings Component Total % of Variance Cumulative % Total % of Variance Cumulative % Total % of Variance Cumulative % 2.423 30.293 30.293 2.423 30.293 30.293 1.879 23.488 23.488 N 1.426 17.822 48.115 1.426 17.822 48.115 1.734 21.676 45.165 co Un A W 1.021 12.760 60.875 1.021 12.760 60.875 1.257 15.710 60.875 886 11.077 71.952 .796 9.955 81.907 .728 9.094 91.001 .607 7.589 98.590 113 1.410 100.000 Extraction Method: Principal Component Analysis Scree Plot 2.5- 2.0- Eigenvalue 1.5- 10- 0.5- 0.0 Component NumberReproduced Correlations degree hrs1 satjob educ tvhours happy life Reproduced Correlation degree anomia5 933 176 -.039 935 .239 .119 230 118 hrs1 176 602a -.239 194 -.576 -.077 .141 ..049 satjob -.039 -.239 .447 .062 214 469 -.436 -.297 educ 935 .194 -.062 .939 ..255 -.142 252 .131 tvhours -.239 .576 .214 -.255 556 066 -.136 .047 happy -.119 -.077 469 -.142 .066 576 -.526 -.412 life .230 .141 -.436 252 -.136 -.526 500 .371 anomia5 .118 -.049 -.297 131 .047 -.412 Residual .371 .317 degree 004 -.068 -.050 032 -.004 ..034 -.037 hrs1 004 .104 011 .361 -.031 -.046 112 satjob -.068 104 -.037 -.105 -.197 .151 .158 educ -.050 .011 .037 026 ..002 .029 -.012 tvhours 032 .361 -.105 026 014 -.012 -.099 happy -.004 -.031 -.197 ..002 014 .159 .177 life -.034 -.046 .151 -.029 -.012 159 -.217 anomia5 -.037 .112 .158 -.012 -.099 .177 -.217 Extraction Method: Principal Component Analysis. a. Reproduced communalities b. Residuals are computed between observed and reproduced correlations. There are 12 (42.0%) nonredundant residuals with absolute values greater than 0.05. a. Assess the eigenvalue criterion. How many components were retained? Is the eigenvalue ap- propriate, considering the number of factors and the communalities? 276b. Assess the variance explained by the retained components. What is the total variability ex plained by the model? Is this amount adequate? c. Assess the scree plot. At which component does the plot begin to level off? (1. Assess the residuals. How many residuals exceed the 0.05 criterion? e. Having applied the four criteria, do you believe the number of components retained in this analy- sis is appropriate? If not, what is your recommendation? 2. Assume that you believe four components should be retained 'om the analysis in the previous exer- cise. Conduct a factor analysis with varimax rotation (be sure to retain four components). a. Evaluate each of the four criteria. Has the model t improved? Explain. b. Provide two alternatives for improving the model


