

Question: Hello can you please do question 2 in MATALAB. The follwing code generates the graphs below. thanks. t = 0:0.1:2; x = 3* exp(j*pi*t+pi/3); x_re
Hello can you please do question 2 in MATALAB. The follwing code generates the graphs below. thanks.
t = 0:0.1:2; x = 3* exp(j*pi*t+pi/3); x_re = real(x); x_im = imag(x); x_mag = abs(x); x_phase = phase(x); figure subplot(3,1,1) plot(t,x_re,t,x_im,'-.') legend('real','imag') title ( 'workshop1 practice 2.1.1') subplot (3,1,2) plot(t,x_mag) ylabel('magnitude') subplot (3,1,3) plot(t,x_phase) ylabel('phase')
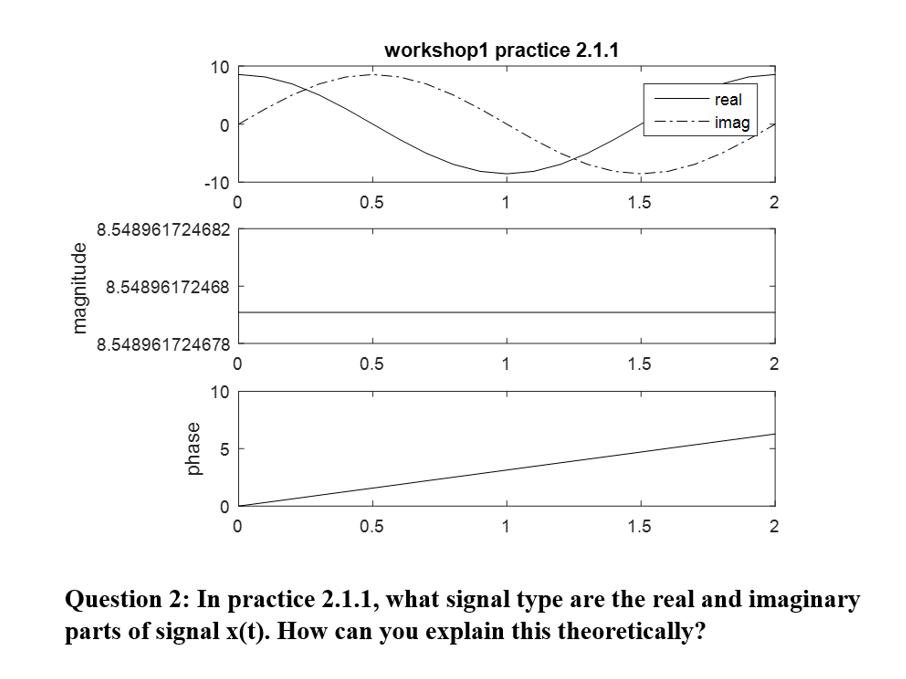
workshop1 practice 2.1.1 10 real --_--imag -10 0.5 8.548961724682 E 8.54896172468 8.548961724678 0.5 10 0.5 Question 2: In practice 2.1.1, what signal type are the real and imaginary parts of signal x(t). How can you explain this theoretically
Step by Step Solution
There are 3 Steps involved in it

Get step-by-step solutions from verified subject matter experts