Hello Chegg users,
I have a problem with solving for ratios specifically debt management ratios which includes debt ratio, liabilities-to-assets ratio, times-interest-earned ratio, EBITDA coverage ratio. If you guys, could help that would be greatly appreciated and if you could give a brief explanation to your answer, it would be helpful to better understand it for future assignments. I apologize for the delay in change but here is the updated financial statements. Thank you! Here are all of General Motors's financial statements as well as my answers:
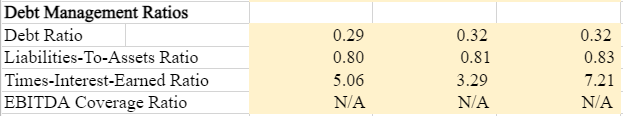
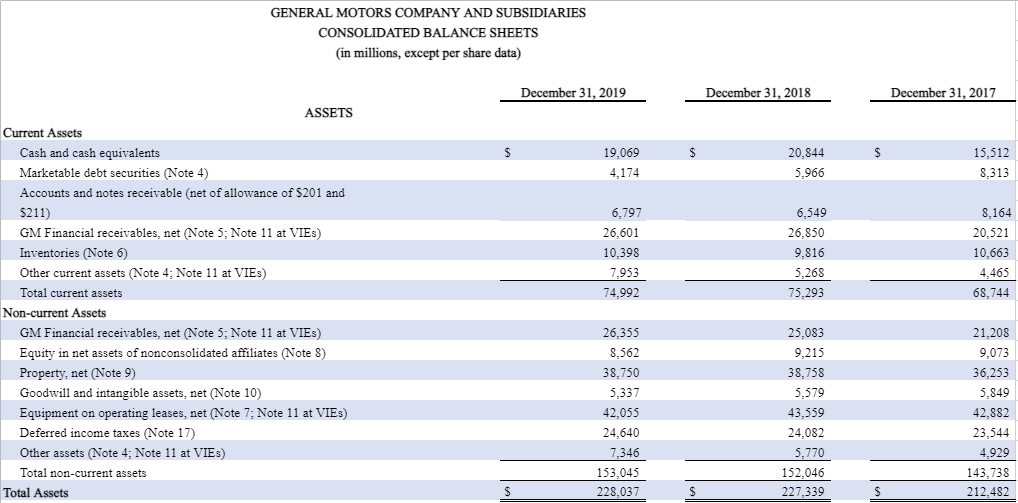
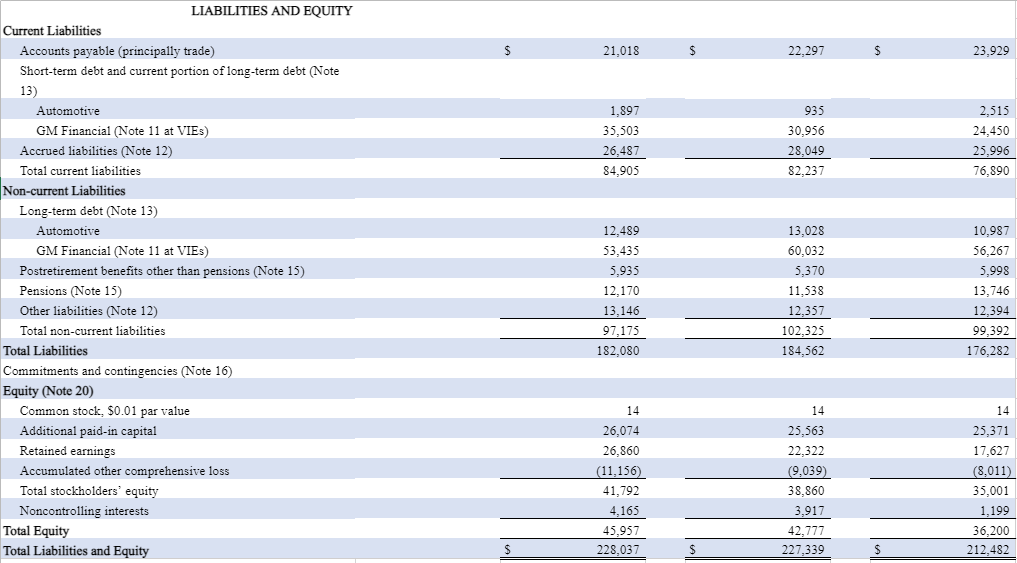
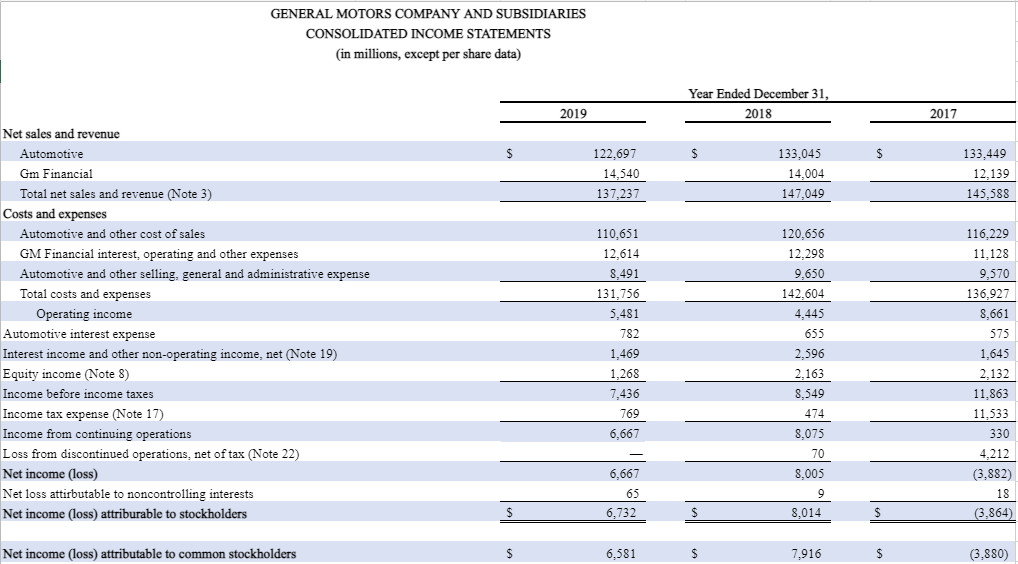
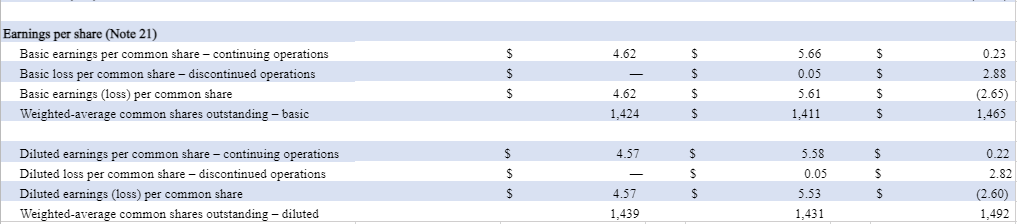
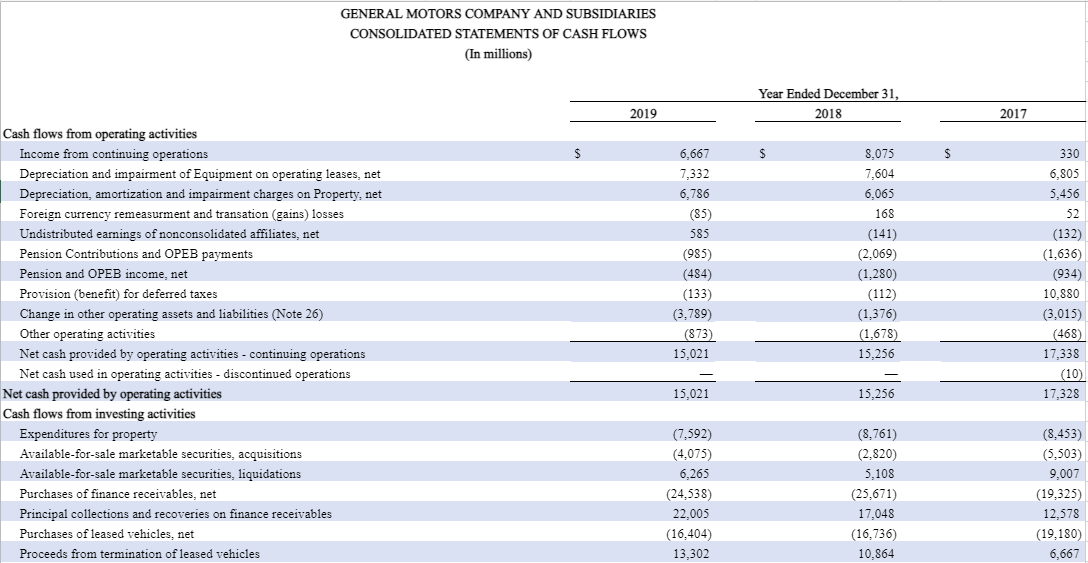
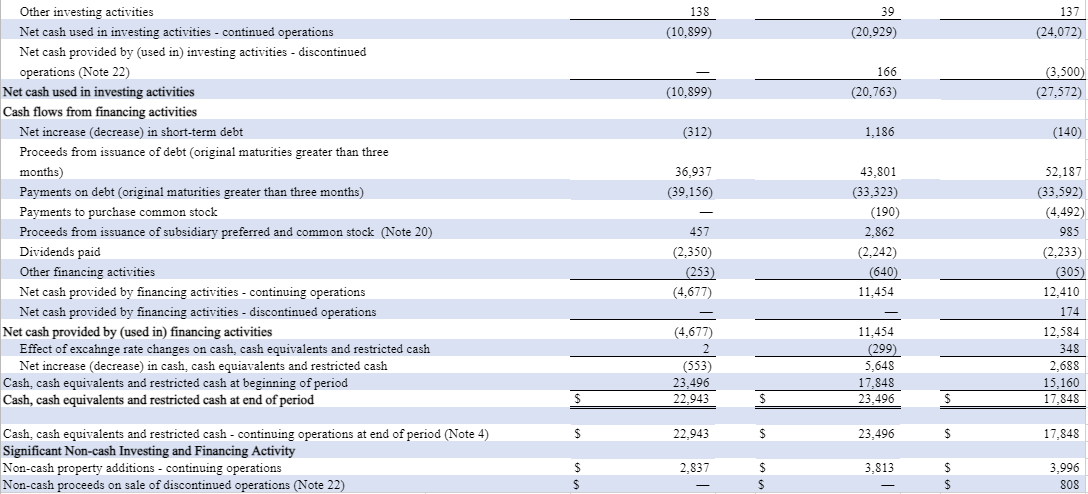
Debt Management Ratios Debt Ratio Liabilities-To-Assets Ratio Times-Interest-Earned Ratio EBITDA Coverage Ratio 0.29 0.80 5.06 N/A 0.32 0.81 3.29 N/A 0.32 0.83 7.21 N/A GENERAL MOTORS COMPANY AND SUBSIDIARIES CONSOLIDATED BALANCE SHEETS (in millions, except per share data) December 31, 2019 December 31, 2018 December 31, 2017 $ 19,069 4.174 20.844 5.966 15,512 8.313 6,797 26,601 10,398 7,953 74.992 6.549 26,850 9,816 5,268 75.293 8,164 20,521 10,663 4,465 68,744 ASSETS Current Assets Cash and cash equivalents Marketable debt securities (Note 4) Accounts and notes receivable (net of allowance of $201 and $211) GM Financial receivables, net (Note 5; Note 11 at VIES) Inventories (Note 6) Other current assets (Note 4: Note 11 at VIES) Total current assets Non-current Assets GM Financial receivables, net (Note 5; Note 11 at VIES) Equity in net assets of nonconsolidated affiliates (Note 8) Property, net (Note 9) Goodwill and intangible assets, net (Note 10) Equipment on operating leases, net (Note 7; Note 11 at VIES) Deferred income taxes (Note 17) Other assets (Note 4; Note 11 at VIES) Total non-current assets Total Assets 26.355 8,562 38,750 5,337 42,055 24,640 7,346 153,045 228,037 25,083 9.215 38,758 5,579 43,559 24,082 5,770 152,046 227,339 21,208 9,073 36,253 5,849 42,882 23,544 4,929 143,738 212,482 $ $ 21,018 $ 22.297 $ 23,929 1.897 35,503 26,487 84.905 935 30,956 28,049 82,237 2.515 24,450 25,996 76,890 LIABILITIES AND EQUITY Current Liabilities Accounts payable (principally trade) Short-term debt and current portion of long-term debt (Note 13) Automotive GM Financial (Note 11 at VIES) Accrued liabilities (Note 12) Total current liabilities Non-current Liabilities Long-term debt (Note 13) Automotive GM Financial (Note 11 at VIES) Postretirement benefits other than pensions (Note 15) Pensions (Note 15) Other liabilities (Note 12) Total non-current liabilities Total Liabilities Commitments and contingencies (Note 16) Equity (Note 20) Common stock, $0.01 par value Additional paid-in capital Retained earnings Accumulated other comprehensive loss Total stockholders' equity Noncontrolling interests Total Equity Total Liabilities and Equity 12.489 53,435 5.935 12,170 13,146 97,175 182,080 13,028 60,032 5,370 11,538 12,357 102,325 184,562 10,987 56,267 5,998 13,746 12 394 99,392 176.282 14 14 26,074 26,860 (11,156) 41,792 4,165 45,957 228,037 14 25,563 22.322 (9,039) 38,860 3,917 42,777 227,339 25,371 17,627 (8,011) 35,001 1,199 36,200 212,482 GENERAL MOTORS COMPANY AND SUBSIDIARIES CONSOLIDATED INCOME STATEMENTS (in millions, except per share data) Year Ended December 31, , 2018 2019 2017 $ $ 122.697 14.540 137,237 133,045 14.004 147,049 133,449 12.139 145,588 Net sales and revenue Automotive Gm Financial Total net sales and revenue (Note 3) Costs and expenses Automotive and other cost of sales GM Financial interest, operating and other expenses Automotive and other selling, general and administrative expense Total costs and expenses Operating income Automotive interest expense Interest income and other non-operating income, net (Note 19) Equity income (Note 8) Income before income taxes Income tax expense (Note 17) Income from continuing operations Loss from discontinued operations, net of tax (Note 22) Net income (loss) Net loss attirbutable to noncontrolling interests Net income (loss) attriburable to stockholders 110,651 12,614 8,491 131,756 5,481 782 1,469 1,268 7,436 769 6,667 120,656 12,298 9,650 142,604 4,445 655 2,596 2,163 8,549 474 8,075 70 8,005 9 8,014 116,229 11.128 9,570 136,927 8,661 575 1,645 2,132 11,863 11,533 330 4,212 (3,882) 18 (3,864) 6,667 65 6,732 $ $ Net income (loss) attributable to common stockholders $ 6,581 $ 7,916 $ (3.880) 4.62 $ Earnings per share (Note 21) Basic earnings per common share - continuing operations Basic loss per common share - discontinued operations Basic earnings (loss) per common share Weighted-average common shares outstanding - basic $ $ $ $ 5.66 0.05 5.61 1,411 $ $ $ 0.23 2.88 (2.65) 1,465 4.62 1,424 $ $ $ 4.57 $ 0.22 $ Diluted earnings per common share - continuing operations Diluted loss per common share - discontinued operations Diluted earnings (loss) per common share Weighted-average common shares outstanding - diluted $ $ $ S 5.58 0.05 5.53 1,431 $ $ 4.57 1,439 2.82 (2.60) 1,492 GENERAL MOTORS COMPANY AND SUBSIDIARIES CONSOLIDATED STATEMENTS OF CASH FLOWS (In millions) Year Ended December 31, 2018 2019 2017 $ $ $ Cash flows from operating activities Income from continuing operations Depreciation and impairment of Equipment on operating leases, net Depreciation, amortization and impairment charges on Property, net Foreign currency remeasurment and transation (gains) losses Undistributed earnings of nonconsolidated affiliates, net Pension Contributions and OPEB payments Pension and OPEB income, net Provision (benefit) for deferred taxes Change in other operating assets and liabilities (Note 26) Other operating activities Net cash provided by operating activities - continuing operations Net cash used in operating activities - discontinued operations Net cash provided by operating activities Cash flows from investing activities Expenditures for property Available-for-sale marketable securities, acquisitions Available-for-sale marketable securities, liquidations Purchases of finance receivables, net Principal collections and recoveries on finance receivables Purchases of leased vehicles, net Proceeds from termination of leased vehicles 6,667 7,332 6,786 (85) 585 (985) (484) (133) (3,789) (873) 15,021 8,075 7,604 6,065 168 (141) (2,069) (1,280) (112) (1,376) (1,678) 330 6.805 5,456 52 (132) (1,636) (934) 10,880 (3.015) (468) 17,338 (10) 17,328 15,256 15,021 15,256 (7,592) (4,075) 6,265 (24.538) 22,005 (16,404) 13,302 (8,761) (2.820) 5,108 (25,671) 17,048 (16,736) 10,864 (8,453) (5,503) 9,007 (19,325) 12,578 (19,180) 6,667 138 (10.899) 39 (20.929) 137 (24.072) 166 (20,763) (3.500) (27,572) (10,899) (312) 1,186 (140) 36,937 (39,156) Other investing activities Net cash used in investing activities - continued operations Net cash provided by (used in) investing activities - discontinued operations (Note 22) Net cash used in investing activities Cash flows from financing activities Net increase (decrease) in short-term debt Proceeds from issuance of debt (original maturities greater than three months) Payments on debt (original maturities greater than three months) Payments to purchase common stock Proceeds from issuance of subsidiary preferred and common stock (Note 20) Dividends paid Other financing activities Net cash provided by financing activities - continuing operations Net cash provided by financing activities - discontinued operations Net cash provided by (used in) financing activities Effect of excahnge rate changes on cash, cash equivalents and restricted cash Net increase (decrease) in cash, cash equiavalents and restricted cash Cash, cash equivalents and restricted cash at beginning of period Cash, cash equivalents and restricted cash at end of period 457 (2,350) (253) (4,677) 43,801 (33,323) (190) 2,862 (2.242) (640) 11,454 52,187 (33,592) (4.492) 985 (2.233) (305) 12,410 174 12.584 348 2.688 15,160 17,848 (4,677) 2 (553) 23,496 22.943 11.454 (299) 5,648 17,848 $ 23,496 $ $ 22,943 $ 23,496 S 17,848 Cash, cash equivalents and restricted cash - continuing operations at end of period (Note 4) Significant Non-cash Investing and Financing Activity Non-cash property additions - continuing operations Non-cash proceeds on sale of discontinued operations (Note 22) 2,837 3,813 $ $ $ $ 3,996 808 Debt Management Ratios Debt Ratio Liabilities-To-Assets Ratio Times-Interest-Earned Ratio EBITDA Coverage Ratio 0.29 0.80 5.06 N/A 0.32 0.81 3.29 N/A 0.32 0.83 7.21 N/A GENERAL MOTORS COMPANY AND SUBSIDIARIES CONSOLIDATED BALANCE SHEETS (in millions, except per share data) December 31, 2019 December 31, 2018 December 31, 2017 $ 19,069 4.174 20.844 5.966 15,512 8.313 6,797 26,601 10,398 7,953 74.992 6.549 26,850 9,816 5,268 75.293 8,164 20,521 10,663 4,465 68,744 ASSETS Current Assets Cash and cash equivalents Marketable debt securities (Note 4) Accounts and notes receivable (net of allowance of $201 and $211) GM Financial receivables, net (Note 5; Note 11 at VIES) Inventories (Note 6) Other current assets (Note 4: Note 11 at VIES) Total current assets Non-current Assets GM Financial receivables, net (Note 5; Note 11 at VIES) Equity in net assets of nonconsolidated affiliates (Note 8) Property, net (Note 9) Goodwill and intangible assets, net (Note 10) Equipment on operating leases, net (Note 7; Note 11 at VIES) Deferred income taxes (Note 17) Other assets (Note 4; Note 11 at VIES) Total non-current assets Total Assets 26.355 8,562 38,750 5,337 42,055 24,640 7,346 153,045 228,037 25,083 9.215 38,758 5,579 43,559 24,082 5,770 152,046 227,339 21,208 9,073 36,253 5,849 42,882 23,544 4,929 143,738 212,482 $ $ 21,018 $ 22.297 $ 23,929 1.897 35,503 26,487 84.905 935 30,956 28,049 82,237 2.515 24,450 25,996 76,890 LIABILITIES AND EQUITY Current Liabilities Accounts payable (principally trade) Short-term debt and current portion of long-term debt (Note 13) Automotive GM Financial (Note 11 at VIES) Accrued liabilities (Note 12) Total current liabilities Non-current Liabilities Long-term debt (Note 13) Automotive GM Financial (Note 11 at VIES) Postretirement benefits other than pensions (Note 15) Pensions (Note 15) Other liabilities (Note 12) Total non-current liabilities Total Liabilities Commitments and contingencies (Note 16) Equity (Note 20) Common stock, $0.01 par value Additional paid-in capital Retained earnings Accumulated other comprehensive loss Total stockholders' equity Noncontrolling interests Total Equity Total Liabilities and Equity 12.489 53,435 5.935 12,170 13,146 97,175 182,080 13,028 60,032 5,370 11,538 12,357 102,325 184,562 10,987 56,267 5,998 13,746 12 394 99,392 176.282 14 14 26,074 26,860 (11,156) 41,792 4,165 45,957 228,037 14 25,563 22.322 (9,039) 38,860 3,917 42,777 227,339 25,371 17,627 (8,011) 35,001 1,199 36,200 212,482 GENERAL MOTORS COMPANY AND SUBSIDIARIES CONSOLIDATED INCOME STATEMENTS (in millions, except per share data) Year Ended December 31, , 2018 2019 2017 $ $ 122.697 14.540 137,237 133,045 14.004 147,049 133,449 12.139 145,588 Net sales and revenue Automotive Gm Financial Total net sales and revenue (Note 3) Costs and expenses Automotive and other cost of sales GM Financial interest, operating and other expenses Automotive and other selling, general and administrative expense Total costs and expenses Operating income Automotive interest expense Interest income and other non-operating income, net (Note 19) Equity income (Note 8) Income before income taxes Income tax expense (Note 17) Income from continuing operations Loss from discontinued operations, net of tax (Note 22) Net income (loss) Net loss attirbutable to noncontrolling interests Net income (loss) attriburable to stockholders 110,651 12,614 8,491 131,756 5,481 782 1,469 1,268 7,436 769 6,667 120,656 12,298 9,650 142,604 4,445 655 2,596 2,163 8,549 474 8,075 70 8,005 9 8,014 116,229 11.128 9,570 136,927 8,661 575 1,645 2,132 11,863 11,533 330 4,212 (3,882) 18 (3,864) 6,667 65 6,732 $ $ Net income (loss) attributable to common stockholders $ 6,581 $ 7,916 $ (3.880) 4.62 $ Earnings per share (Note 21) Basic earnings per common share - continuing operations Basic loss per common share - discontinued operations Basic earnings (loss) per common share Weighted-average common shares outstanding - basic $ $ $ $ 5.66 0.05 5.61 1,411 $ $ $ 0.23 2.88 (2.65) 1,465 4.62 1,424 $ $ $ 4.57 $ 0.22 $ Diluted earnings per common share - continuing operations Diluted loss per common share - discontinued operations Diluted earnings (loss) per common share Weighted-average common shares outstanding - diluted $ $ $ S 5.58 0.05 5.53 1,431 $ $ 4.57 1,439 2.82 (2.60) 1,492 GENERAL MOTORS COMPANY AND SUBSIDIARIES CONSOLIDATED STATEMENTS OF CASH FLOWS (In millions) Year Ended December 31, 2018 2019 2017 $ $ $ Cash flows from operating activities Income from continuing operations Depreciation and impairment of Equipment on operating leases, net Depreciation, amortization and impairment charges on Property, net Foreign currency remeasurment and transation (gains) losses Undistributed earnings of nonconsolidated affiliates, net Pension Contributions and OPEB payments Pension and OPEB income, net Provision (benefit) for deferred taxes Change in other operating assets and liabilities (Note 26) Other operating activities Net cash provided by operating activities - continuing operations Net cash used in operating activities - discontinued operations Net cash provided by operating activities Cash flows from investing activities Expenditures for property Available-for-sale marketable securities, acquisitions Available-for-sale marketable securities, liquidations Purchases of finance receivables, net Principal collections and recoveries on finance receivables Purchases of leased vehicles, net Proceeds from termination of leased vehicles 6,667 7,332 6,786 (85) 585 (985) (484) (133) (3,789) (873) 15,021 8,075 7,604 6,065 168 (141) (2,069) (1,280) (112) (1,376) (1,678) 330 6.805 5,456 52 (132) (1,636) (934) 10,880 (3.015) (468) 17,338 (10) 17,328 15,256 15,021 15,256 (7,592) (4,075) 6,265 (24.538) 22,005 (16,404) 13,302 (8,761) (2.820) 5,108 (25,671) 17,048 (16,736) 10,864 (8,453) (5,503) 9,007 (19,325) 12,578 (19,180) 6,667 138 (10.899) 39 (20.929) 137 (24.072) 166 (20,763) (3.500) (27,572) (10,899) (312) 1,186 (140) 36,937 (39,156) Other investing activities Net cash used in investing activities - continued operations Net cash provided by (used in) investing activities - discontinued operations (Note 22) Net cash used in investing activities Cash flows from financing activities Net increase (decrease) in short-term debt Proceeds from issuance of debt (original maturities greater than three months) Payments on debt (original maturities greater than three months) Payments to purchase common stock Proceeds from issuance of subsidiary preferred and common stock (Note 20) Dividends paid Other financing activities Net cash provided by financing activities - continuing operations Net cash provided by financing activities - discontinued operations Net cash provided by (used in) financing activities Effect of excahnge rate changes on cash, cash equivalents and restricted cash Net increase (decrease) in cash, cash equiavalents and restricted cash Cash, cash equivalents and restricted cash at beginning of period Cash, cash equivalents and restricted cash at end of period 457 (2,350) (253) (4,677) 43,801 (33,323) (190) 2,862 (2.242) (640) 11,454 52,187 (33,592) (4.492) 985 (2.233) (305) 12,410 174 12.584 348 2.688 15,160 17,848 (4,677) 2 (553) 23,496 22.943 11.454 (299) 5,648 17,848 $ 23,496 $ $ 22,943 $ 23,496 S 17,848 Cash, cash equivalents and restricted cash - continuing operations at end of period (Note 4) Significant Non-cash Investing and Financing Activity Non-cash property additions - continuing operations Non-cash proceeds on sale of discontinued operations (Note 22) 2,837 3,813 $ $ $ $ 3,996 808