Answered step by step
Verified Expert Solution
Question
1 Approved Answer
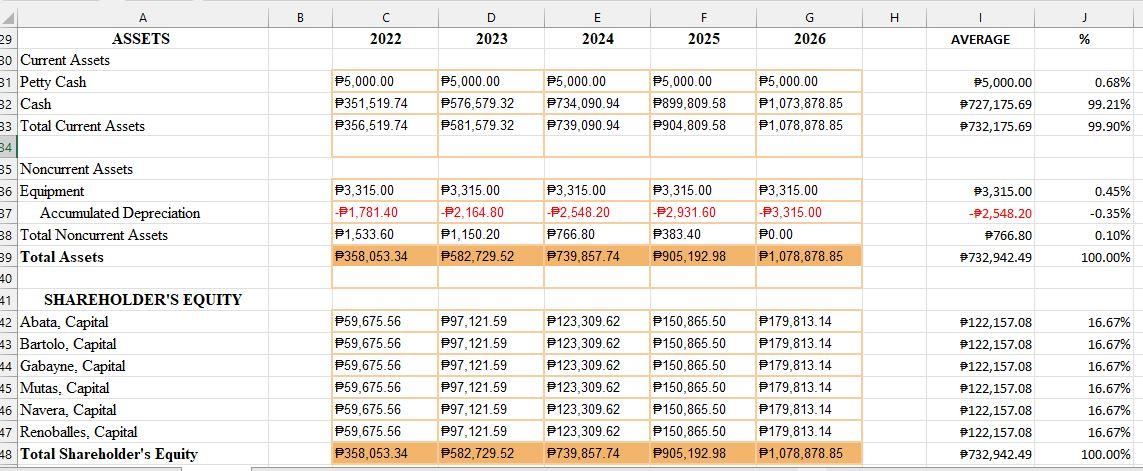
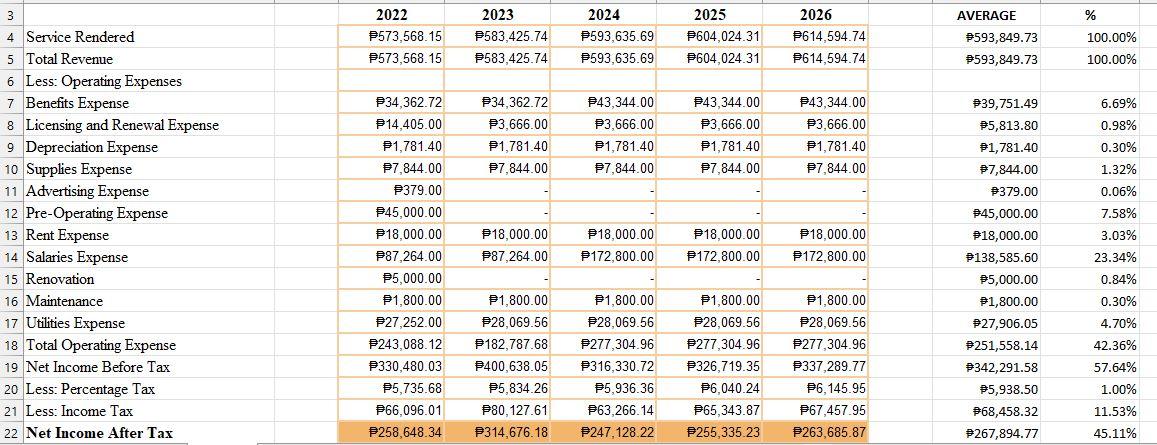
Hello, help me create a descriptive analysis on the 5-year financial figures of VERTICAL ANALYSIS on Balance Sheet and Income Statement pls. I'll give thumbs
Hello, help me create a descriptive analysis on the 5-year financial figures of VERTICAL ANALYSIS on Balance Sheet and Income Statement pls. I'll give thumbs up afterwards.
Balance Sheet
INCOME STATEMENT

29 30 Current Assets A ASSETS 31 Petty Cash 32 Cash 33 Total Current Assets 34 35 Noncurrent Assets 36 Equipment 37 38 Total Noncurrent Assets 39 Total Assets -40 Accumulated Depreciation 41 SHAREHOLDER'S EQUITY 42 Abata, Capital 43 Bartolo, Capital 44 Gabayne, Capital 45 Mutas, Capital 46 Navera, Capital 47 Renoballes, Capital 48 Total Shareholder's Equity B 2022 D 2023 P5,000.00 F5,000.00 P5,000.00 P351,519.74 P576,579.32 P734,090.94 P356,519.74 P581,579.32 P3,315.00 P3,315.00 -P1,781.40 -P2,164.80 P1,533.60 P1,150.20 P358,053.34 P582,729.52 P59,675.56 P59,675.56 P59,675.56 P97,121.59 P97,121.59 P97,121.59 P59,675.56 P97,121.59 P59,675.56 P97,121.59 P59,675.56 P97,121.59 P358,053.34 P582,729.52 E 2024 F 2025 F5.000.00 P899,809.58 P739,090.94 P904,809.58 P3,315.00 -#2,548.20 #766.80 P739,857.74 P3,315.00 -P2,931.60 P383.40 P905, 192.98 G 2026 95.000.00 P1,073,878.85 P1,078,878.85 P3,315.00 -P3,315.00 P0.00 P1,078,878.85 P123,309.62 P150,865.50 P179,813.14 #123,309.62 P150,865.50 P179,813.14 P123,309.62 P150,865.50 179,813.14 P123,309.62 P150,865.50 P179,813.14 P123,309.62 P150,865.50 P179,813.14 #123,309.62 P150,865.50 P179,813.14 P739,857.74 P905,192.98 P1,078,878.85 H 1 AVERAGE #5,000.00 #727,175.69 #732,175.69 #3,315.00 -$2,548.20 #766.80 #732,942.49 #122,157.08 #122,157.08 #122,157.08 #122,157.08 #122,157.08 #122,157.08 #732,942.49 J % 0.68% 99.21% 99.90% 0.45% -0.35% 0.10% 100.00% 16.67% 16.67% 16.67% 16.67% 16.67% 16.67% 100.00% 3 4 Service Rendered 5 Total Revenue 6 Less: Operating Expenses 7 Benefits Expense 8 Licensing and Renewal Expense 9 Depreciation Expense 10 Supplies Expense 11 Advertising Expense 12 Pre-Operating Expense 13 Rent Expense 14 Salaries Expense 15 Renovation 16 Maintenance 17 Utilities Expense 18 Total Operating Expense 19 Net Income Before Tax 20 Less: Percentage Tax 21 Less: Income Tax 22 Net Income After Tax 2023 2022 P573,568.15 P583,425.74 P573,568.15 P583,425.74 P34,362.72 P14,405.00 P1,781.40 P7,844.00 P379.00 P34,362.72 P3,666.00 P1,781.40 P7,844.00 2024 2025 P593,635.69 #604,024.31 P593,635.69 P604,024.31 P43,344.00 #3,666.00 P1,781.40 P7,844.00 #45,000.00 P18,000.00 P87,264.00 95,000.00 P1,800.00 P1,800.00 #1,800.00 P27,252.00 #28,069.56 P28,069.56 #243,088.12 P182,787.68 #277,304.96 P330,480.03 P400,638.05 5,735.68 P316,330.72 P5,834.26 P66,096.01 P80,127.61 P258,648.34 P314,676.18 #43,344.00 P3,666.00 P1,781.40 P7,844.00 P18,000.00 P18,000.00 P18,000.00 #87,264.00 P172,800.00 P172,800.00 5.936.36 P63,266.14 #1,800.00 #28,069.56 #277,304.96 P326,719.35 #6,040.24 P65,343.87 #247,128.22 P255,335.23 2026 #614,594.74 P614,594.74 P43,344.00 $3,666.00 P1,781.40 #7,844.00 P18,000.00 #172,800.00 P1,800.00 P28,069.56 P277,304.96 P337,289.77 P6,145.95 P67,457.95 P263,685.87 AVERAGE #593,849.73 #593,849.73 #39,751.49 #5,813.80 #1,781.40 #7,844.00 #379.00 #45,000.00 #18,000.00 #138,585.60 $5,000.00 #1,800.00 #27,906.05 #251,558.14 #342,291.58 $5,938.50 #68,458.32 #267,894.77 % 100.00% 100.00% 6.69% 0.98% 0.30% 1.32% 0.06% 7.58% 3.03% 23.34% 0.84% 0.30% 4.70% 42.36% 57.64% 1.00% 11.53% 45.11% 29 30 Current Assets A ASSETS 31 Petty Cash 32 Cash 33 Total Current Assets 34 35 Noncurrent Assets 36 Equipment 37 38 Total Noncurrent Assets 39 Total Assets -40 Accumulated Depreciation 41 SHAREHOLDER'S EQUITY 42 Abata, Capital 43 Bartolo, Capital 44 Gabayne, Capital 45 Mutas, Capital 46 Navera, Capital 47 Renoballes, Capital 48 Total Shareholder's Equity B 2022 D 2023 P5,000.00 F5,000.00 P5,000.00 P351,519.74 P576,579.32 P734,090.94 P356,519.74 P581,579.32 P3,315.00 P3,315.00 -P1,781.40 -P2,164.80 P1,533.60 P1,150.20 P358,053.34 P582,729.52 P59,675.56 P59,675.56 P59,675.56 P97,121.59 P97,121.59 P97,121.59 P59,675.56 P97,121.59 P59,675.56 P97,121.59 P59,675.56 P97,121.59 P358,053.34 P582,729.52 E 2024 F 2025 F5.000.00 P899,809.58 P739,090.94 P904,809.58 P3,315.00 -#2,548.20 #766.80 P739,857.74 P3,315.00 -P2,931.60 P383.40 P905, 192.98 G 2026 95.000.00 P1,073,878.85 P1,078,878.85 P3,315.00 -P3,315.00 P0.00 P1,078,878.85 P123,309.62 P150,865.50 P179,813.14 #123,309.62 P150,865.50 P179,813.14 P123,309.62 P150,865.50 179,813.14 P123,309.62 P150,865.50 P179,813.14 P123,309.62 P150,865.50 P179,813.14 #123,309.62 P150,865.50 P179,813.14 P739,857.74 P905,192.98 P1,078,878.85 H 1 AVERAGE #5,000.00 #727,175.69 #732,175.69 #3,315.00 -$2,548.20 #766.80 #732,942.49 #122,157.08 #122,157.08 #122,157.08 #122,157.08 #122,157.08 #122,157.08 #732,942.49 J % 0.68% 99.21% 99.90% 0.45% -0.35% 0.10% 100.00% 16.67% 16.67% 16.67% 16.67% 16.67% 16.67% 100.00% 3 4 Service Rendered 5 Total Revenue 6 Less: Operating Expenses 7 Benefits Expense 8 Licensing and Renewal Expense 9 Depreciation Expense 10 Supplies Expense 11 Advertising Expense 12 Pre-Operating Expense 13 Rent Expense 14 Salaries Expense 15 Renovation 16 Maintenance 17 Utilities Expense 18 Total Operating Expense 19 Net Income Before Tax 20 Less: Percentage Tax 21 Less: Income Tax 22 Net Income After Tax 2023 2022 P573,568.15 P583,425.74 P573,568.15 P583,425.74 P34,362.72 P14,405.00 P1,781.40 P7,844.00 P379.00 P34,362.72 P3,666.00 P1,781.40 P7,844.00 2024 2025 P593,635.69 #604,024.31 P593,635.69 P604,024.31 P43,344.00 #3,666.00 P1,781.40 P7,844.00 #45,000.00 P18,000.00 P87,264.00 95,000.00 P1,800.00 P1,800.00 #1,800.00 P27,252.00 #28,069.56 P28,069.56 #243,088.12 P182,787.68 #277,304.96 P330,480.03 P400,638.05 5,735.68 P316,330.72 P5,834.26 P66,096.01 P80,127.61 P258,648.34 P314,676.18 #43,344.00 P3,666.00 P1,781.40 P7,844.00 P18,000.00 P18,000.00 P18,000.00 #87,264.00 P172,800.00 P172,800.00 5.936.36 P63,266.14 #1,800.00 #28,069.56 #277,304.96 P326,719.35 #6,040.24 P65,343.87 #247,128.22 P255,335.23 2026 #614,594.74 P614,594.74 P43,344.00 $3,666.00 P1,781.40 #7,844.00 P18,000.00 #172,800.00 P1,800.00 P28,069.56 P277,304.96 P337,289.77 P6,145.95 P67,457.95 P263,685.87 AVERAGE #593,849.73 #593,849.73 #39,751.49 #5,813.80 #1,781.40 #7,844.00 #379.00 #45,000.00 #18,000.00 #138,585.60 $5,000.00 #1,800.00 #27,906.05 #251,558.14 #342,291.58 $5,938.50 #68,458.32 #267,894.77 % 100.00% 100.00% 6.69% 0.98% 0.30% 1.32% 0.06% 7.58% 3.03% 23.34% 0.84% 0.30% 4.70% 42.36% 57.64% 1.00% 11.53% 45.11%
Step by Step Solution
There are 3 Steps involved in it
Step: 1

Get Instant Access to Expert-Tailored Solutions
See step-by-step solutions with expert insights and AI powered tools for academic success
Step: 2

Step: 3

Ace Your Homework with AI
Get the answers you need in no time with our AI-driven, step-by-step assistance
Get Started


