

Answered step by step
Verified Expert Solution
Question
1 Approved Answer
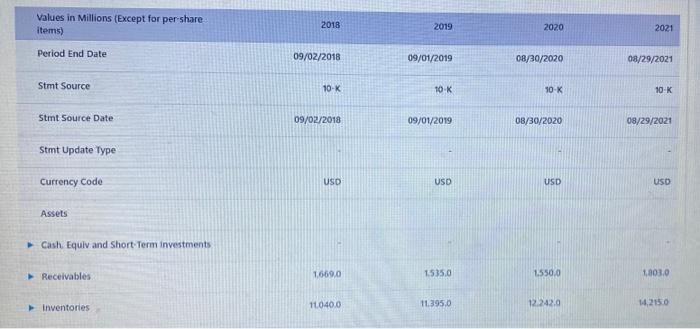
Hello here is the Income statement and balance sheet for Walmart and Costco. Costco Income statement Costco's Balance sheet Walmart income statement Balance sheet of
Hello here is the Income statement and balance sheet for Walmart and Costco. 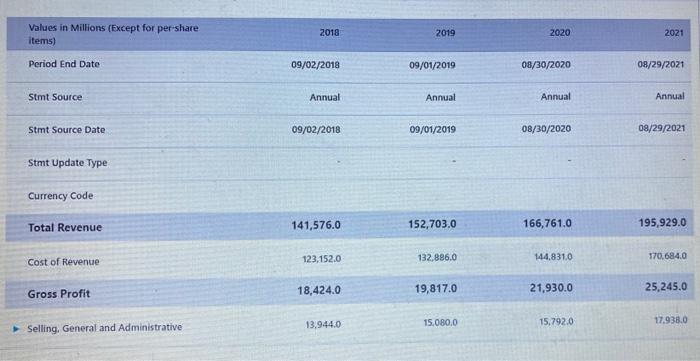
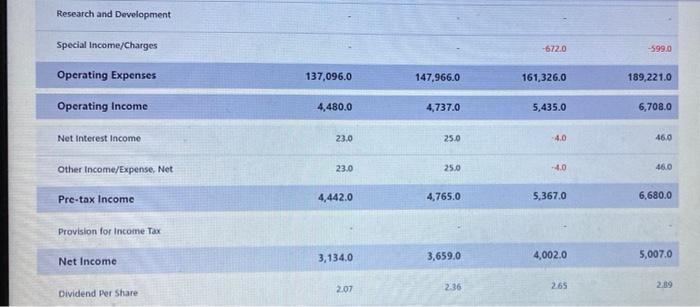
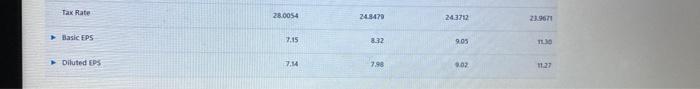
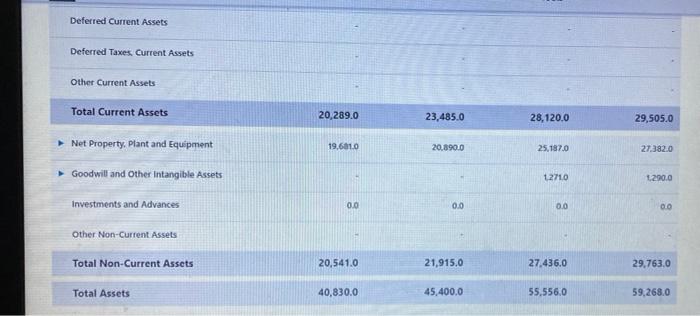
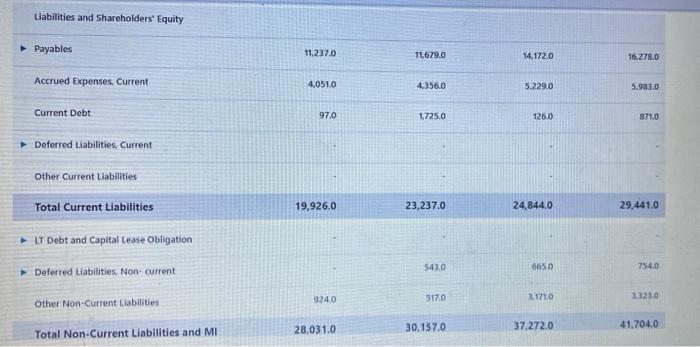
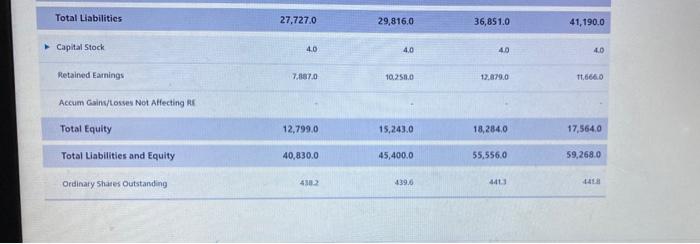
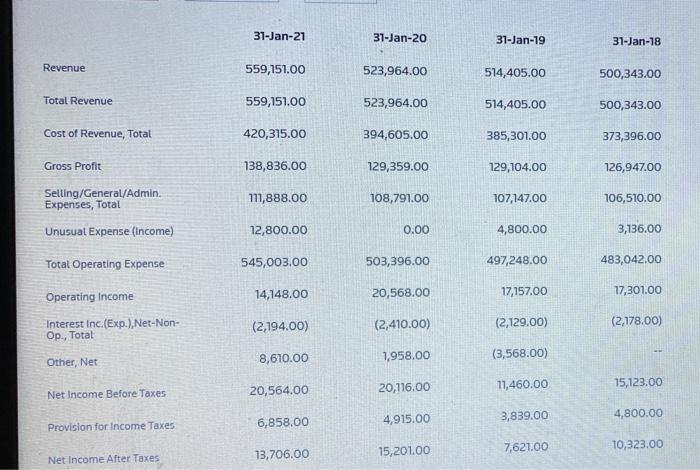
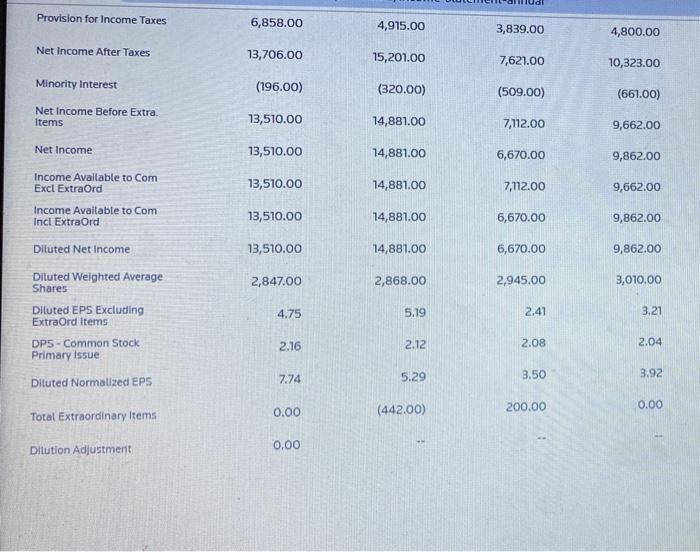
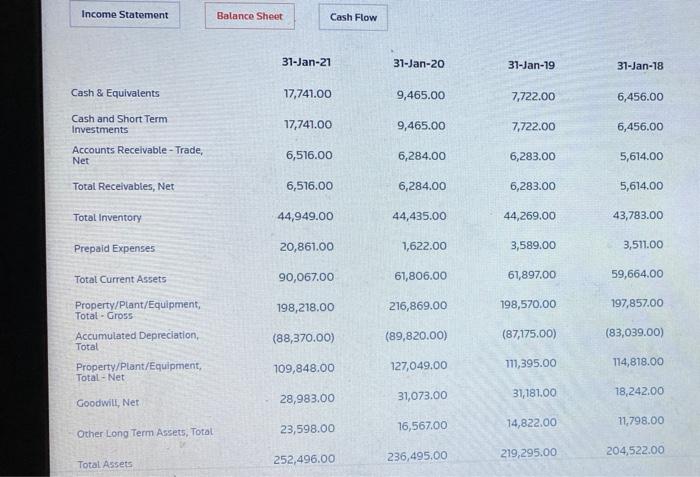
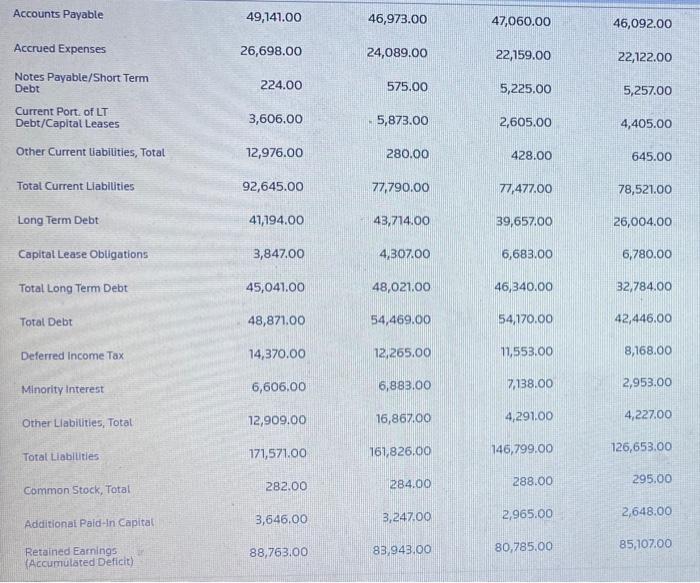
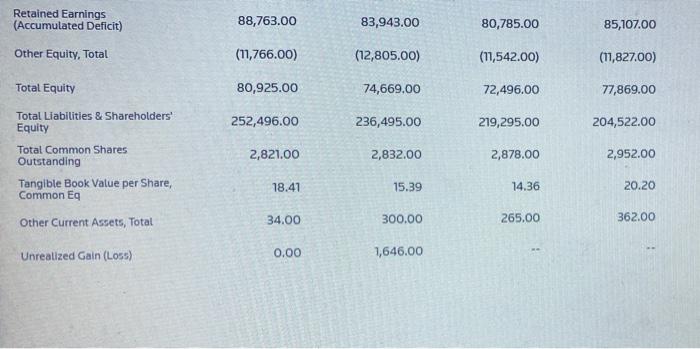
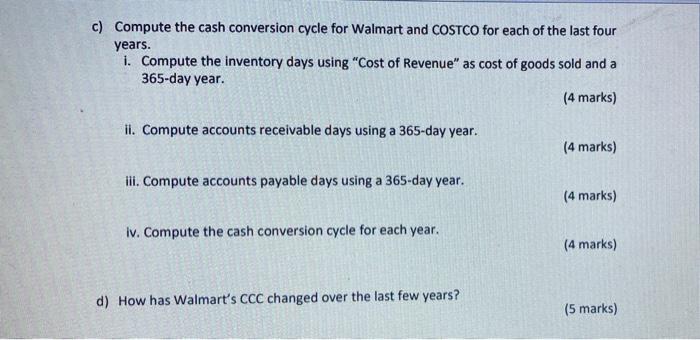
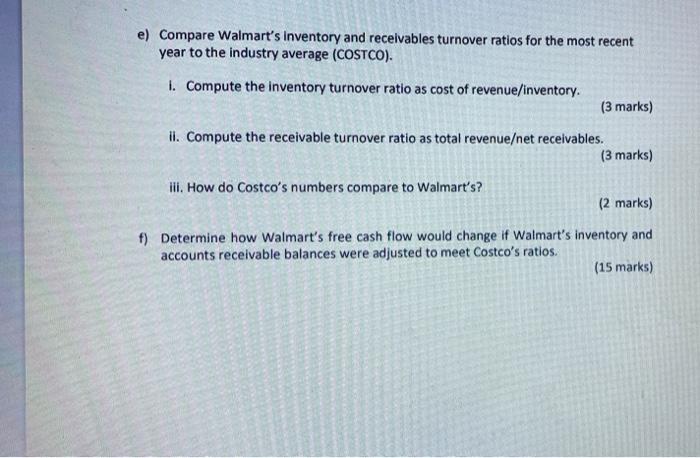
2018 2019 2020 2021 Values in Millions (Except for per share items) Period End Date 09/02/2018 09/01/2019 08/30/2020 08/29/2021 Stmt Source Annual Annual Annual Annual Stmt Source Date 09/02/2018 09/01/2019 08/30/2020 08/29/2021 Stmt Update Type Currency Code Total Revenue 141,576.0 152,703.0 166,761.0 195,929.0 123.152.0 132,886.0 144,8310 170,684.0 Cost of Revenue Gross Profit 18,424.0 19,817.0 21,930.0 25,245.0 13.944.0 15.080.0 15.792.0 17.938.0 Selling, General and Administrative Research and Development Special Income/Charges -6720 -599.0 Operating Expenses 137,096.0 147.966.0 161,326.0 189,221.0 Operating Income 4,480.0 4.737.0 5,435.0 6,708.0 Net Interest Income 23.0 25.0 -4.0 46,0 Other Income/Expense, Net 23.0 25.0 -4.0 46.0 Pre-tax Income 4,442.0 4,765.0 5,367.0 6,680.0 Provision for Income Tax 3,134,0 Net Income 3,659.0 4,002.0 5,007.0 22.07 22:36 265 2.89 Dividend Per Share Tax Rate 28.0054 24.8470 243712 219671 Basic FPS 7.15 8.32 9.05 TO Diluted EPS 7.14 7.98 907 11.27 Values in Millions (Except for per share items) 2018 2019 2020 2021 Period End Date 09/02/2018 09/01/2019 08/30/2020 08/29/2021 Stmt Source 10-K 10-K 10-K 10-K Stmt Source Date 09/02/2018 09/01/2019 08/30/2020 08/29/2021 Stmt Update Type Currency Code USD USD USD USD Assets Cash Equiv and Short Term investments Receivables 16690 1535.0 1.550.0 1,8030 11.040.0 inventories 11.395,0 14,2150 12.242.0 Deferred Current Assets Deferred Taxes. Current Assets Other Current Assets Total Current Assets 20,289.0 23,485.0 28,120.0 29,505.0 Net Property. Plant and Equipment 19,6010 20,8900 25,187.0 27.382.0 Goodwill and other intangible Assets 12710 1290.0 Investments and Advances 0.0 0.0 0.0 0.0 Other Non-Current Assets Total Non-Current Assets 20,541.0 21,915.0 27.436.0 29,763,0 Total Assets 40,830.0 45,400.0 55.556.0 59,268.0 Liabilities and Shareholders' Equity Payables 11.237.0 11,679.0 14,172,0 16, 278.0 Accrued Expenses. Current 4.051.0 4.356.0 5.229.0 5.983.0 Current Debt 970 1.725.0 126.0 871.0 Deferred Liabilities. Current Other Current Liabilities Total Current Liabilities 19,926.0 23,237.0 24,844.0 29,441.0 LT Debt and Capital Lease Obligation 543.0 665.0 7540 Deferred Liabilities, Non-current 9240 5170 3.171.0 21210 Other Non-Current Liabilities 28.031.0 30.157.0 37.272.0 41.704,0 Total Non-Current Liabilities and MI Total Liabilities 27,727.0 29,816,0 36,851.0 41,190.0 Capital Stock 4.0 4.0 4.0 40 Retained Earnings 7,387.0 10.250.0 12.879.0 11.665.0 Accum Gains/losses Not Affecting Total Equity 12,799,0 15,243.0 18,284,0 17,564,0 40,830.0 45,400.0 55,556.0 59,268.0 Total Liabilities and Equity Ordinaty Shates Outstanding 430 139.6 441 31-Jan-21 31-Jan-20 31-Jan-19 31-Jan-18 Revenue 559,151.00 523,964.00 514,405.00 500,343.00 Total Revenue 559,151.00 523,964.00 514,405.00 500,343.00 Cost of Revenue, Total 420,315.00 394,605.00 385,301.00 373,396.00 Gross Profit 138,836.00 129,359.00 129,104.00 126,947.00 Selling/General/Admin Expenses, Total 711,888.00 108,791.00 107,147.00 106,510.00 nusual Expense (Income) 12,800.00 0.00 4,800.00 3,136.00 Total Operating Expense 545,003.00 503,396.00 497,248.00 483,042.00 14,148.00 Operating Income 20,568.00 17,301.00 17,157.00 Interest Inc.(Exp.), Net-Non- Op., Total (2,194.00) (2,410.00) (2,129.00) (2,178.00) 8,610.00 1,958.00 (3,568.00) Other, Net 20,116.00 20,564.00 11,460.00 15,123.00 Net Income Before Taxes 4,915.00 3,839.00 4,800.00 6,858.00 Provision for Income Taxes 15,201.00 13,706.00 7,621.00 10,323.00 Net Income After Taxes Provision for Income Taxes 6,858.00 4,915.00 3,839.00 4,800.00 Net Income After Taxes 13,706.00 15,201.00 7,621.00 10,323.00 Minority Interest (196.00) (320.00) (509.00) (661.00) Net Income Before Extra. Items 13,510.00 14,881.00 7,112.00 9,662.00 Net Income 13,510.00 74,881.00 6,670.00 9,862.00 Income Available to Com Excl Extraord 13,510.00 14,881.00 7,112.00 9,662.00 Income Available to com Incl Extraord 13,510.00 14,881.00 6,670.00 9,862.00 Diluted Net Income 13,510.00 14,881.00 6,670.00 9,862.00 2,847.00 2,868.00 2,945.00 3,010.00 Dituted Weighted Average Shares Diluted EPS Excluding ExtraOrd Items 4.75 5.19 2.41 3.21 2.16 2.12 2.08 DPS - Common Stock Primary Issue 2.04 7.74 5.29 3.50 3.92 Diluted Normalized EPS 0.00 0.00 200.00 Total Extraordinary Items (442.00) Ditution Adjustment 0.00 Income Statement Balance Sheet Cash Flow 31-Jan-21 31-Jan-20 31-Jan-19 31-Jan-18 Cash & Equivalents 17,741.00 9,465.00 7,722.00 6,456.00 17,741.00 9,465.00 7,722.00 6,456.00 Cash and Short Term Investments Accounts Receivable-Trade, Net 6,516.00 6,284.00 6,283.00 5,614.00 Total Receivables, Net 6,516.00 6,284.00 6,283.00 5,614.00 Total Inventory 44,949.00 44,435.00 44,269.00 43,783.00 Prepaid Expenses 20,861.00 1,622.00 3,589.00 3,511.00 Total Current Assets 90,067.00 61,806.00 61,897.00 59,664.00 198,218.00 216,869.00 198,570.00 197,857.00 Property/Plant/Equipment, Total - Gross Accumulated Depreciation, Total Property/Plant/Equipment, Total-Net (88,370.00) (89,820.00) (87,175.00) (83,039.00) 109,848.00 127,049.00 111,395.00 114,818.00 28,983.00 31,073.00 31,181.00 18,242.00 Goodwill, Net 11,798.00 23,598.00 16,567.00 14,822.00 Other Long Term Assets, Total 236,495.00 252,496.00 219,295.00 204,522.00 Total Assets Accounts Payable 49,141.00 46,973.00 47,060.00 46,092.00 Accrued Expenses 26,698.00 24,089.00 22,159.00 22,122.00 Notes Payable/Short Term Debt 224.00 575.00 5,225.00 5,257.00 Current Port of LT Debt/Capital Leases 3,606,00 5,873.00 2,605.00 4,405.00 Other Current Labilities, Total 12,976.00 280.00 428.00 645.00 Total Current Liabilities 92,645.00 77,790.00 77,477.00 78,521.00 Long Term Debt 41,194.00 43,714.00 39,657.00 26,004.00 Capital Lease Obligations 3,847.00 4,307.00 6,683.00 6,780.00 Total Long Term Debt 45,041.00 48,021.00 46,340.00 32,784.00 Total Debt 48,871.00 54,469.00 54,170.00 42,446.00 Deferred Income Tax 14,370.00 12,265.00 11,553.00 8,168.00 Minority Interest 6,606.00 6,883.00 7,138.00 2,953.00 12,909.00 16,867.00 4,291.00 Other Liabilities, Total 4,227.00 171,571.00 Total Liabilities 161,826.00 146,799.00 126,653.00 282.00 284.00 288.00 295.00 Common Stock, Total 3,247.00 3,646.00 2,965.00 2,648.00 Additional Paid In Capital Retained Earnings (Accumulated Deficit) 88,763.00 83,943.00 85,107.00 80,785.00 Retained Earnings (Accumulated Deficit) 88,763.00 83,943.00 80,785.00 85,107.00 Other Equity, Total (11,766.00) (12,805.00) (11,542.00) (11,827.00) Total Equity 80,925.00 74,669.00 72,496.00 77,869.00 252,496.00 236,495.00 219,295.00 204,522.00 Total Liabilities & Shareholders Equity Total Common Shares Outstanding Tangible Book Value per Share, Common Eq 2,821.00 2,832.00 2,878.00 2,952.00 18.41 15.39 14.36 20.20 Other Current Assets, Total 34.00 300.00 265.00 362.00 Unrealized Gain (Loss) 0.00 1,646.00 c) Compute the cash conversion cycle for Walmart and COSTCO for each of the last four years. i. Compute the inventory days using "Cost of Revenue" as cost of goods sold and a 365-day year. (4 marks) ii. Compute accounts receivable days using a 365-day year. (4 marks) ili. Compute accounts payable days using a 365-day year. (4 marks) iv. Compute the cash conversion cycle for each year. (4 marks) d) How has Walmart's CCC changed over the last few years? (5 marks) e) Compare Walmart's Inventory and receivables turnover ratios for the most recent year to the industry average (COSTCO). 1. Compute the inventory turnover ratio as cost of revenue/inventory. (3 marks) ii. Compute the receivable turnover ratio as total revenueet receivables. (3 marks) ill. How do Costco's numbers compare to Walmart's? (2 marks) f) Determine how Walmart's free cash flow would change if Walmart's inventory and accounts receivable balances were adjusted to meet Costco's ratios. (15 marks) 2018 2019 2020 2021 Values in Millions (Except for per share items) Period End Date 09/02/2018 09/01/2019 08/30/2020 08/29/2021 Stmt Source Annual Annual Annual Annual Stmt Source Date 09/02/2018 09/01/2019 08/30/2020 08/29/2021 Stmt Update Type Currency Code Total Revenue 141,576.0 152,703.0 166,761.0 195,929.0 123.152.0 132,886.0 144,8310 170,684.0 Cost of Revenue Gross Profit 18,424.0 19,817.0 21,930.0 25,245.0 13.944.0 15.080.0 15.792.0 17.938.0 Selling, General and Administrative Research and Development Special Income/Charges -6720 -599.0 Operating Expenses 137,096.0 147.966.0 161,326.0 189,221.0 Operating Income 4,480.0 4.737.0 5,435.0 6,708.0 Net Interest Income 23.0 25.0 -4.0 46,0 Other Income/Expense, Net 23.0 25.0 -4.0 46.0 Pre-tax Income 4,442.0 4,765.0 5,367.0 6,680.0 Provision for Income Tax 3,134,0 Net Income 3,659.0 4,002.0 5,007.0 22.07 22:36 265 2.89 Dividend Per Share Tax Rate 28.0054 24.8470 243712 219671 Basic FPS 7.15 8.32 9.05 TO Diluted EPS 7.14 7.98 907 11.27 Values in Millions (Except for per share items) 2018 2019 2020 2021 Period End Date 09/02/2018 09/01/2019 08/30/2020 08/29/2021 Stmt Source 10-K 10-K 10-K 10-K Stmt Source Date 09/02/2018 09/01/2019 08/30/2020 08/29/2021 Stmt Update Type Currency Code USD USD USD USD Assets Cash Equiv and Short Term investments Receivables 16690 1535.0 1.550.0 1,8030 11.040.0 inventories 11.395,0 14,2150 12.242.0 Deferred Current Assets Deferred Taxes. Current Assets Other Current Assets Total Current Assets 20,289.0 23,485.0 28,120.0 29,505.0 Net Property. Plant and Equipment 19,6010 20,8900 25,187.0 27.382.0 Goodwill and other intangible Assets 12710 1290.0 Investments and Advances 0.0 0.0 0.0 0.0 Other Non-Current Assets Total Non-Current Assets 20,541.0 21,915.0 27.436.0 29,763,0 Total Assets 40,830.0 45,400.0 55.556.0 59,268.0 Liabilities and Shareholders' Equity Payables 11.237.0 11,679.0 14,172,0 16, 278.0 Accrued Expenses. Current 4.051.0 4.356.0 5.229.0 5.983.0 Current Debt 970 1.725.0 126.0 871.0 Deferred Liabilities. Current Other Current Liabilities Total Current Liabilities 19,926.0 23,237.0 24,844.0 29,441.0 LT Debt and Capital Lease Obligation 543.0 665.0 7540 Deferred Liabilities, Non-current 9240 5170 3.171.0 21210 Other Non-Current Liabilities 28.031.0 30.157.0 37.272.0 41.704,0 Total Non-Current Liabilities and MI Total Liabilities 27,727.0 29,816,0 36,851.0 41,190.0 Capital Stock 4.0 4.0 4.0 40 Retained Earnings 7,387.0 10.250.0 12.879.0 11.665.0 Accum Gains/losses Not Affecting Total Equity 12,799,0 15,243.0 18,284,0 17,564,0 40,830.0 45,400.0 55,556.0 59,268.0 Total Liabilities and Equity Ordinaty Shates Outstanding 430 139.6 441 31-Jan-21 31-Jan-20 31-Jan-19 31-Jan-18 Revenue 559,151.00 523,964.00 514,405.00 500,343.00 Total Revenue 559,151.00 523,964.00 514,405.00 500,343.00 Cost of Revenue, Total 420,315.00 394,605.00 385,301.00 373,396.00 Gross Profit 138,836.00 129,359.00 129,104.00 126,947.00 Selling/General/Admin Expenses, Total 711,888.00 108,791.00 107,147.00 106,510.00 nusual Expense (Income) 12,800.00 0.00 4,800.00 3,136.00 Total Operating Expense 545,003.00 503,396.00 497,248.00 483,042.00 14,148.00 Operating Income 20,568.00 17,301.00 17,157.00 Interest Inc.(Exp.), Net-Non- Op., Total (2,194.00) (2,410.00) (2,129.00) (2,178.00) 8,610.00 1,958.00 (3,568.00) Other, Net 20,116.00 20,564.00 11,460.00 15,123.00 Net Income Before Taxes 4,915.00 3,839.00 4,800.00 6,858.00 Provision for Income Taxes 15,201.00 13,706.00 7,621.00 10,323.00 Net Income After Taxes Provision for Income Taxes 6,858.00 4,915.00 3,839.00 4,800.00 Net Income After Taxes 13,706.00 15,201.00 7,621.00 10,323.00 Minority Interest (196.00) (320.00) (509.00) (661.00) Net Income Before Extra. Items 13,510.00 14,881.00 7,112.00 9,662.00 Net Income 13,510.00 74,881.00 6,670.00 9,862.00 Income Available to Com Excl Extraord 13,510.00 14,881.00 7,112.00 9,662.00 Income Available to com Incl Extraord 13,510.00 14,881.00 6,670.00 9,862.00 Diluted Net Income 13,510.00 14,881.00 6,670.00 9,862.00 2,847.00 2,868.00 2,945.00 3,010.00 Dituted Weighted Average Shares Diluted EPS Excluding ExtraOrd Items 4.75 5.19 2.41 3.21 2.16 2.12 2.08 DPS - Common Stock Primary Issue 2.04 7.74 5.29 3.50 3.92 Diluted Normalized EPS 0.00 0.00 200.00 Total Extraordinary Items (442.00) Ditution Adjustment 0.00 Income Statement Balance Sheet Cash Flow 31-Jan-21 31-Jan-20 31-Jan-19 31-Jan-18 Cash & Equivalents 17,741.00 9,465.00 7,722.00 6,456.00 17,741.00 9,465.00 7,722.00 6,456.00 Cash and Short Term Investments Accounts Receivable-Trade, Net 6,516.00 6,284.00 6,283.00 5,614.00 Total Receivables, Net 6,516.00 6,284.00 6,283.00 5,614.00 Total Inventory 44,949.00 44,435.00 44,269.00 43,783.00 Prepaid Expenses 20,861.00 1,622.00 3,589.00 3,511.00 Total Current Assets 90,067.00 61,806.00 61,897.00 59,664.00 198,218.00 216,869.00 198,570.00 197,857.00 Property/Plant/Equipment, Total - Gross Accumulated Depreciation, Total Property/Plant/Equipment, Total-Net (88,370.00) (89,820.00) (87,175.00) (83,039.00) 109,848.00 127,049.00 111,395.00 114,818.00 28,983.00 31,073.00 31,181.00 18,242.00 Goodwill, Net 11,798.00 23,598.00 16,567.00 14,822.00 Other Long Term Assets, Total 236,495.00 252,496.00 219,295.00 204,522.00 Total Assets Accounts Payable 49,141.00 46,973.00 47,060.00 46,092.00 Accrued Expenses 26,698.00 24,089.00 22,159.00 22,122.00 Notes Payable/Short Term Debt 224.00 575.00 5,225.00 5,257.00 Current Port of LT Debt/Capital Leases 3,606,00 5,873.00 2,605.00 4,405.00 Other Current Labilities, Total 12,976.00 280.00 428.00 645.00 Total Current Liabilities 92,645.00 77,790.00 77,477.00 78,521.00 Long Term Debt 41,194.00 43,714.00 39,657.00 26,004.00 Capital Lease Obligations 3,847.00 4,307.00 6,683.00 6,780.00 Total Long Term Debt 45,041.00 48,021.00 46,340.00 32,784.00 Total Debt 48,871.00 54,469.00 54,170.00 42,446.00 Deferred Income Tax 14,370.00 12,265.00 11,553.00 8,168.00 Minority Interest 6,606.00 6,883.00 7,138.00 2,953.00 12,909.00 16,867.00 4,291.00 Other Liabilities, Total 4,227.00 171,571.00 Total Liabilities 161,826.00 146,799.00 126,653.00 282.00 284.00 288.00 295.00 Common Stock, Total 3,247.00 3,646.00 2,965.00 2,648.00 Additional Paid In Capital Retained Earnings (Accumulated Deficit) 88,763.00 83,943.00 85,107.00 80,785.00 Retained Earnings (Accumulated Deficit) 88,763.00 83,943.00 80,785.00 85,107.00 Other Equity, Total (11,766.00) (12,805.00) (11,542.00) (11,827.00) Total Equity 80,925.00 74,669.00 72,496.00 77,869.00 252,496.00 236,495.00 219,295.00 204,522.00 Total Liabilities & Shareholders Equity Total Common Shares Outstanding Tangible Book Value per Share, Common Eq 2,821.00 2,832.00 2,878.00 2,952.00 18.41 15.39 14.36 20.20 Other Current Assets, Total 34.00 300.00 265.00 362.00 Unrealized Gain (Loss) 0.00 1,646.00 c) Compute the cash conversion cycle for Walmart and COSTCO for each of the last four years. i. Compute the inventory days using "Cost of Revenue" as cost of goods sold and a 365-day year. (4 marks) ii. Compute accounts receivable days using a 365-day year. (4 marks) ili. Compute accounts payable days using a 365-day year. (4 marks) iv. Compute the cash conversion cycle for each year. (4 marks) d) How has Walmart's CCC changed over the last few years? (5 marks) e) Compare Walmart's Inventory and receivables turnover ratios for the most recent year to the industry average (COSTCO). 1. Compute the inventory turnover ratio as cost of revenue/inventory. (3 marks) ii. Compute the receivable turnover ratio as total revenueet receivables. (3 marks) ill. How do Costco's numbers compare to Walmart's? (2 marks) f) Determine how Walmart's free cash flow would change if Walmart's inventory and accounts receivable balances were adjusted to meet Costco's ratios. (15 marks) Costco Income statement
Costco's Balance sheet
Walmart income statement
Balance sheet of Walmart
Here are the question:
Step by Step Solution
There are 3 Steps involved in it
Step: 1

Get Instant Access to Expert-Tailored Solutions
See step-by-step solutions with expert insights and AI powered tools for academic success
Step: 2

Step: 3
Ace Your Homework with AI
Get the answers you need in no time with our AI-driven, step-by-step assistance
Get Started
Trading Strategies For Capital Markets
Authors: Joseph Benning
1st Edition
0071726233