
Hello, I am having difficulty trying to understand these questions.
I need a tutor to HELP me understand and solve these highlighted Questions.
I need you to EXPLAIN to me STEP BY STEP how you got the answer because I am very CLUELESS in this subject. I have an EXAM coming up very soon and I need good explanation on how to solve the high lighted problems.
EXPLAIN IN DETAIL HOW YOU GOT ANSWER I CANT FAIL THIS TEST COMING UP.
Only the highlighted questions.
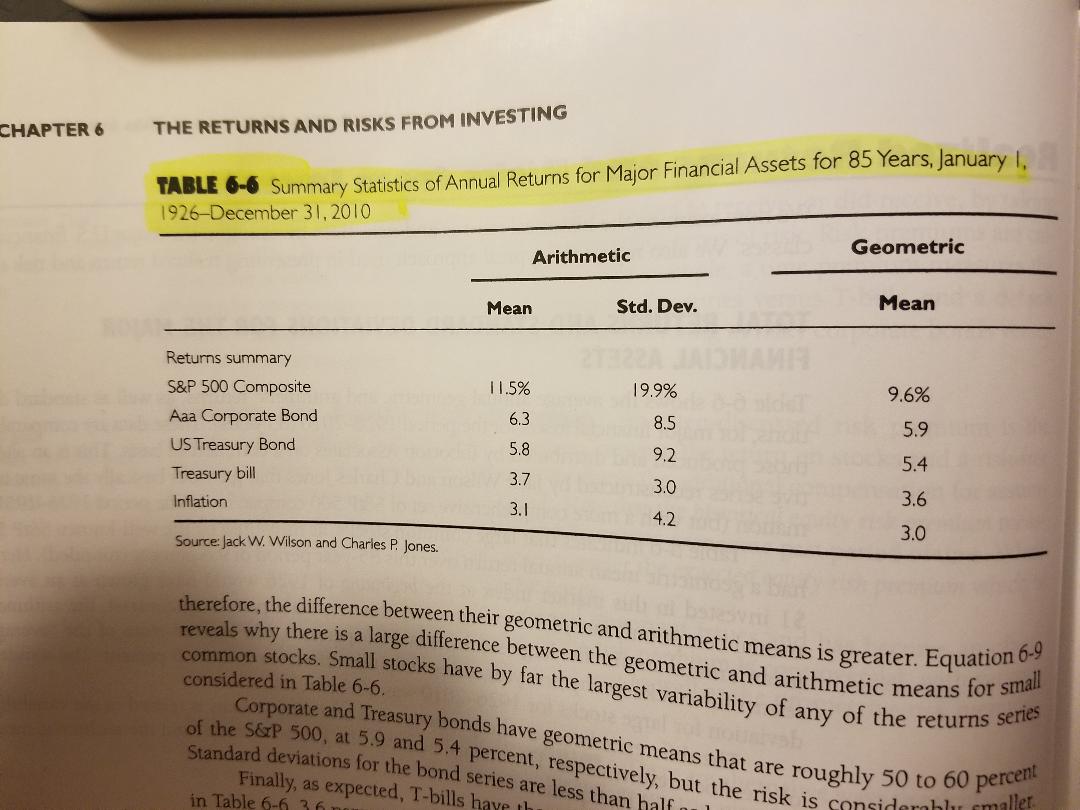
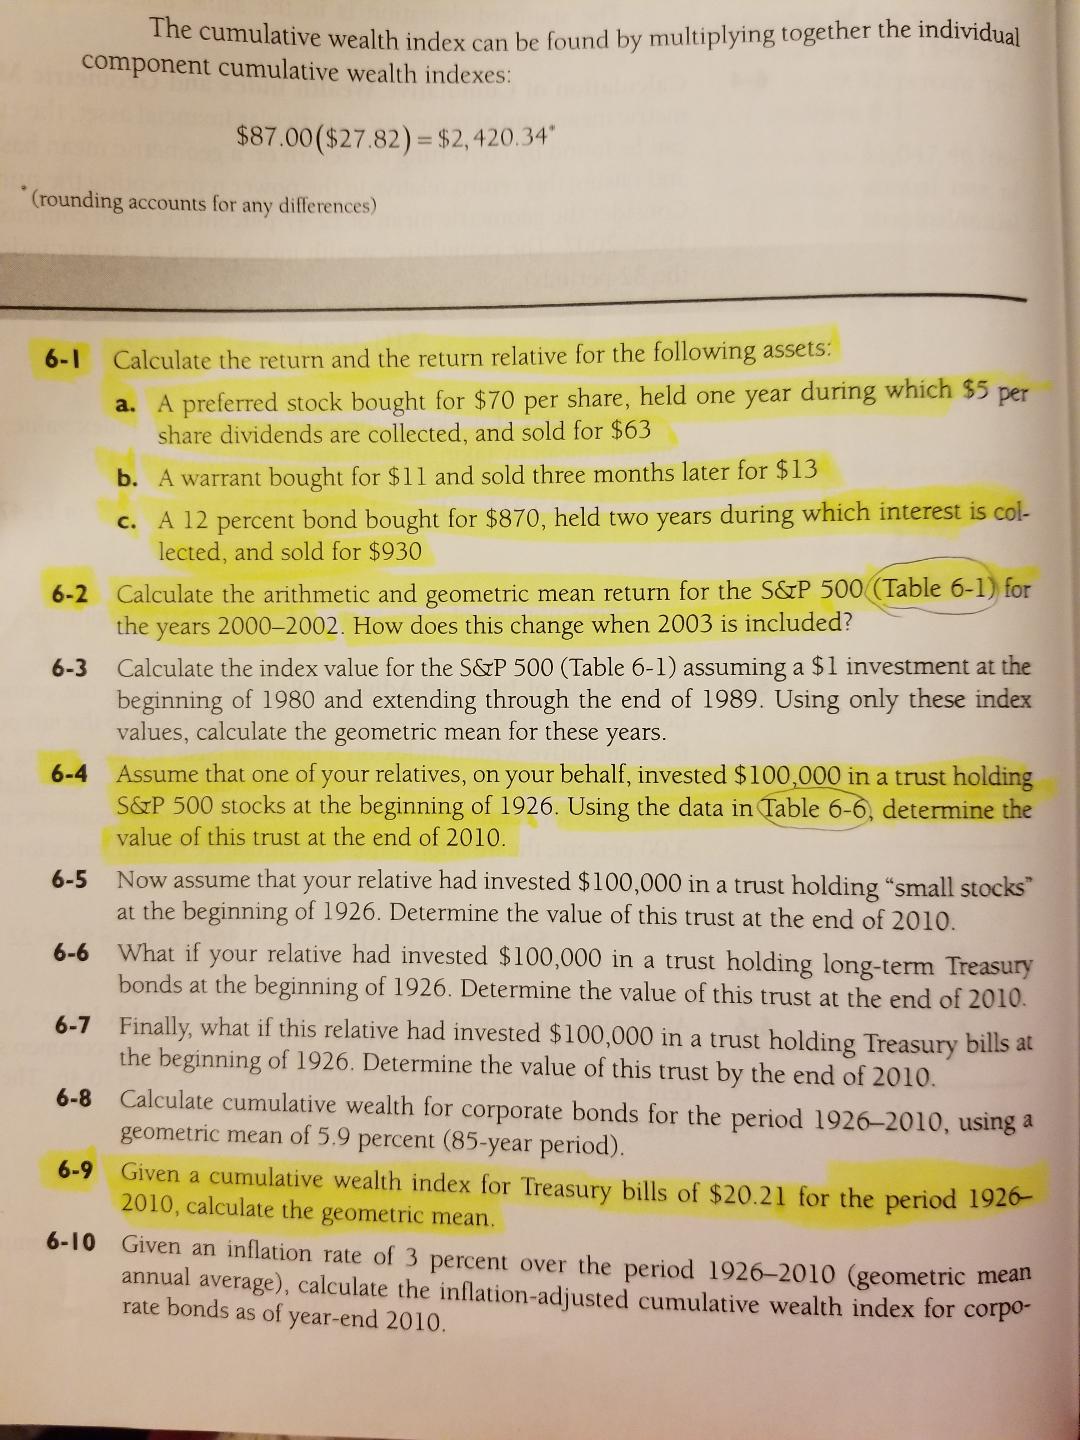
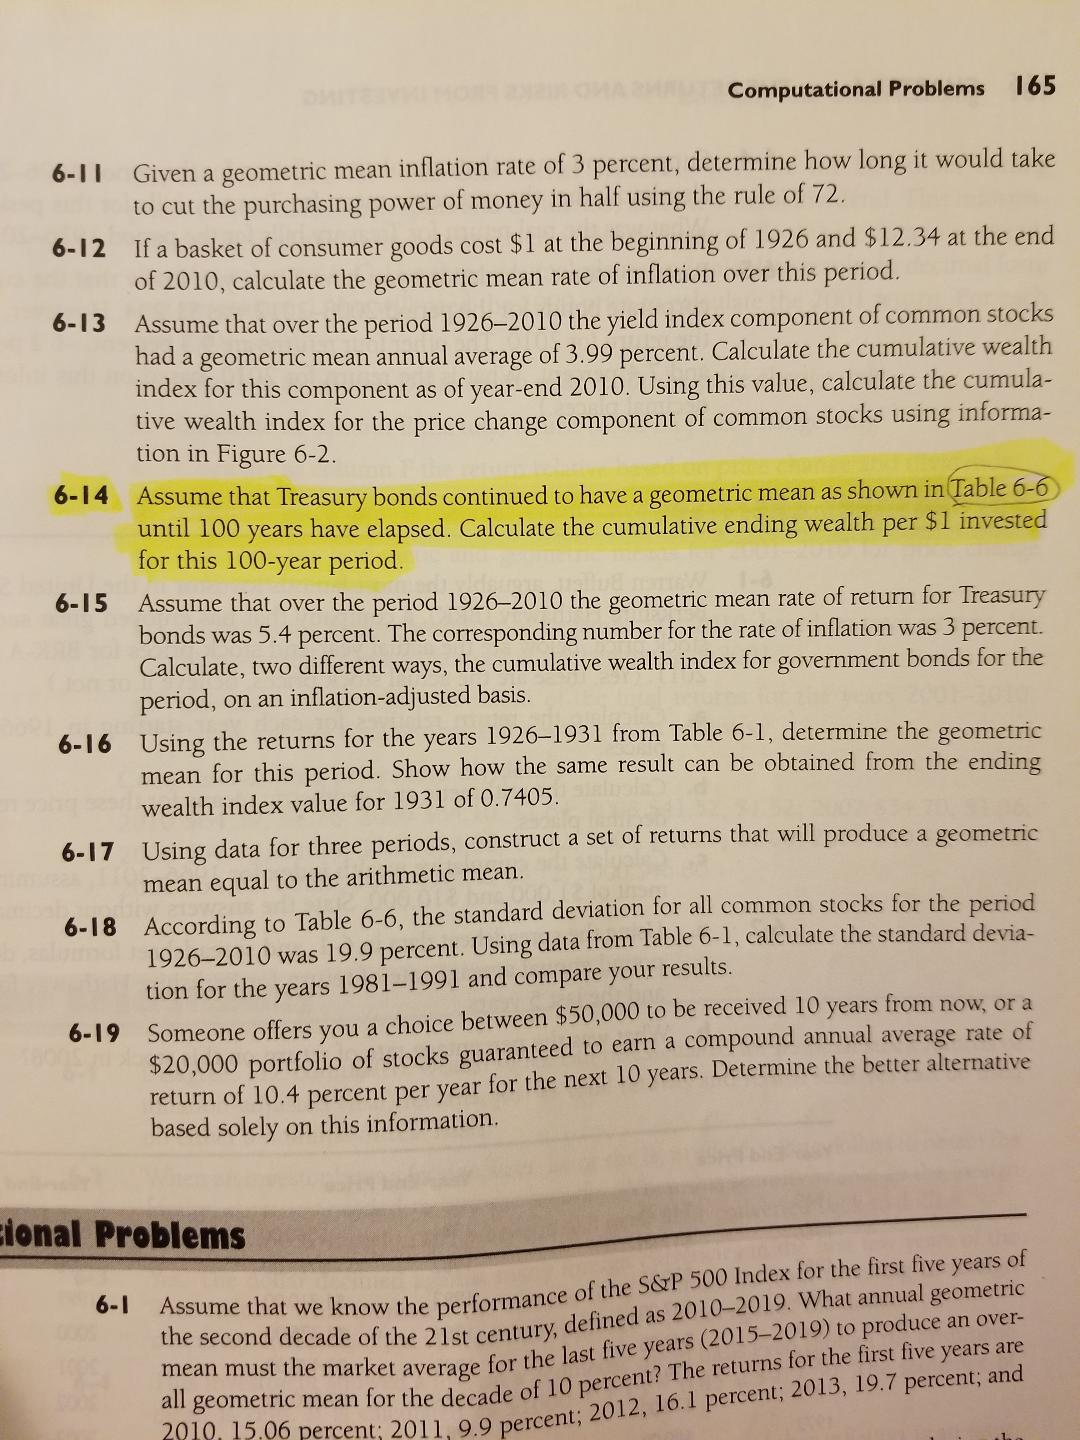
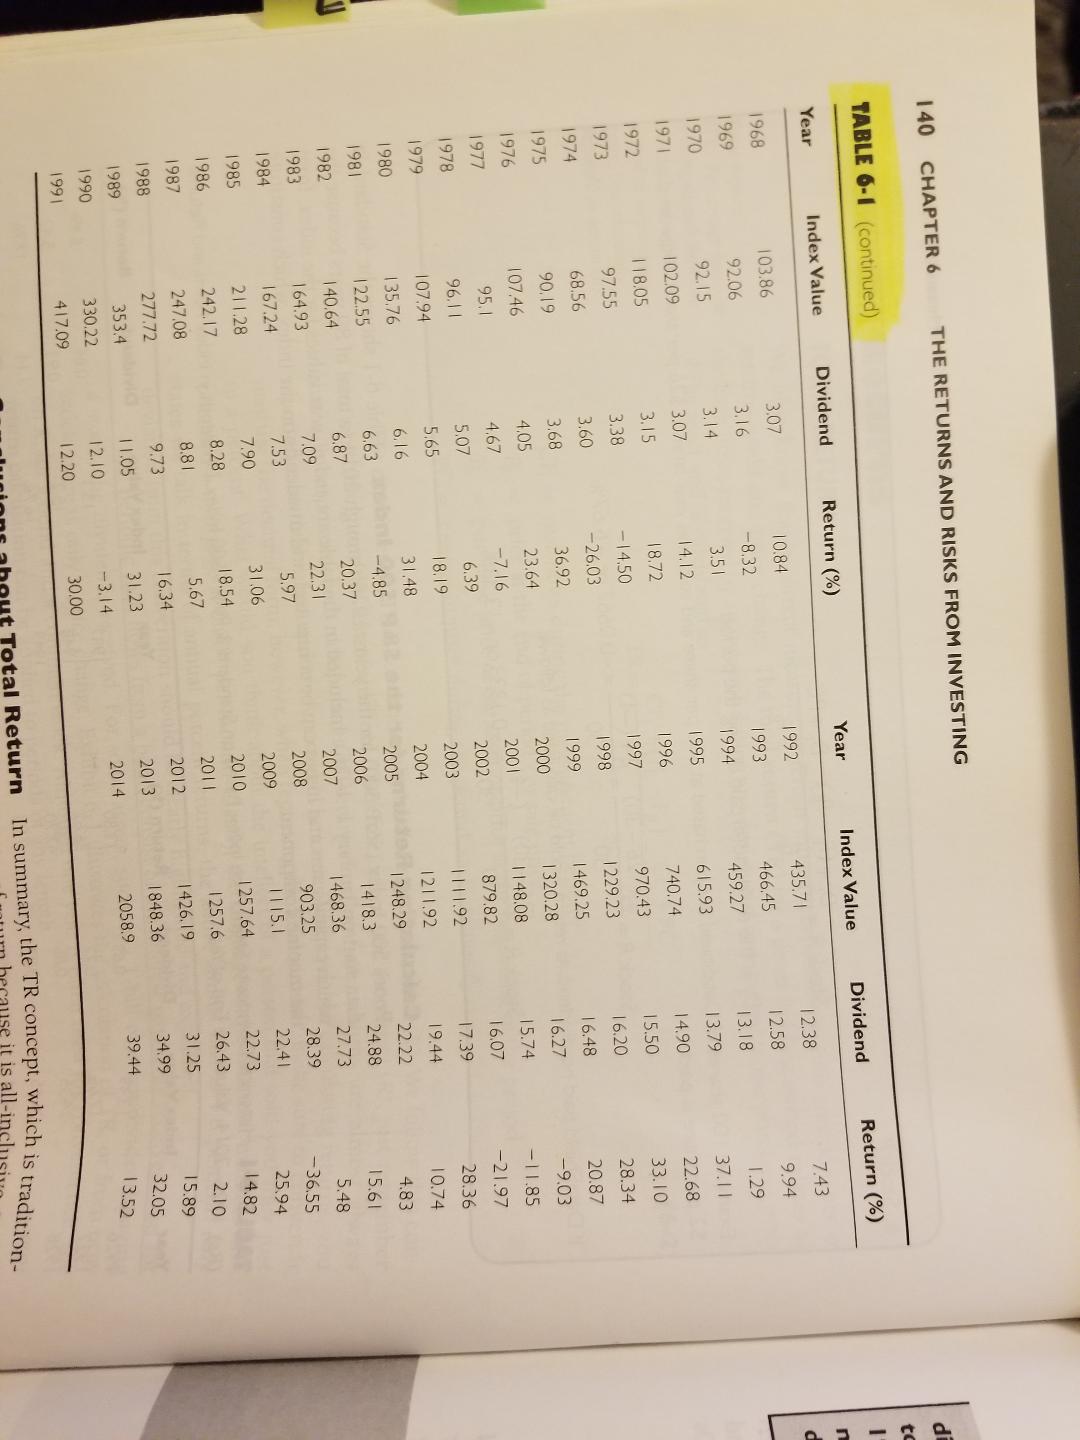
The cumulative wealth index can be found by multiplying together the individual component cumulative wealth indexes: $87.00 ($27.82) = $2, 420.34" (rounding accounts for any differences) 6-1 Calculate the return and the return relative for the following assets: a. A preferred stock bought for $70 per share, held one year during which $5 per share dividends are collected, and sold for $63 b. A warrant bought for $1 1 and sold three months later for $13 c. A 12 percent bond bought for $870, held two years during which interest is col- lected, and sold for $930 6-2 Calculate the arithmetic and geometric mean return for the S&P 500((Table 6-1) for the years 2000-2002. How does this change when 2003 is included? 6-3 Calculate the index value for the S&P 500 (Table 6-1) assuming a $1 investment at the beginning of 1980 and extending through the end of 1989. Using only these index values, calculate the geometric mean for these years. 6-4 Assume that one of your relatives, on your behalf, invested $100,000 in a trust holding S&P 500 stocks at the beginning of 1926. Using the data in Table 6-6, determine the value of this trust at the end of 2010. 6-5 Now assume that your relative had invested $100,000 in a trust holding "small stocks" at the beginning of 1926. Determine the value of this trust at the end of 2010. 6-6 What if your relative had invested $100,000 in a trust holding long-term Treasury bonds at the beginning of 1926. Determine the value of this trust at the end of 2010. 6-7 Finally, what if this relative had invested $100,000 in a trust holding Treasury bills at the beginning of 1926. Determine the value of this trust by the end of 2010. 6-8 Calculate cumulative wealth for corporate bonds for the period 1926-2010, using a geometric mean of 5.9 percent (85-year period) 6-9 Given a cumulative wealth index for Treasury bills of $20.21 for the period 1926- 2010, calculate the geometric mean. 6-10 Given an inflation rate of 3 percent over the period 1926-2010 (geometric mean annual average), calculate the inflation-adjusted cumulative wealth index for corpo- rate bonds as of year-end 2010.Computational Problems 165 6-1 1 Given a geometric mean inflation rate of 3 percent, determine how long it would take to cut the purchasing power of money in half using the rule of 72. 6-12 If a basket of consumer goods cost $1 at the beginning of 1926 and $12.34 at the end of 2010, calculate the geometric mean rate of inflation over this period. 6-13 Assume that over the period 1926-2010 the yield index component of common stocks had a geometric mean annual average of 3.99 percent. Calculate the cumulative wealth index for this component as of year-end 2010. Using this value, calculate the cumula- tive wealth index for the price change component of common stocks using informa- tion in Figure 6-2. 6-14 Assume that Treasury bonds continued to have a geometric mean as shown in Table 6-6 until 100 years have elapsed. Calculate the cumulative ending wealth per $1 invested for this 100-year period. 6-15 Assume that over the period 1926-2010 the geometric mean rate of return for Treasury bonds was 5.4 percent. The corresponding number for the rate of inflation was 3 percent. Calculate, two different ways, the cumulative wealth index for government bonds for the period, on an inflation-adjusted basis. 6-16 Using the returns for the years 1926-1931 from Table 6-1, determine the geometric mean for this period. Show how the same result can be obtained from the ending wealth index value for 1931 of 0.7405. 6-17 Using data for three periods, construct a set of returns that will produce a geometric mean equal to the arithmetic mean. 6-18 According to Table 6-6, the standard deviation for all common stocks for the period 1926-2010 was 19.9 percent. Using data from Table 6-1, calculate the standard devia- tion for the years 1981-1991 and compare your results. 6-19 Someone offers you a choice between $50,000 to be received 10 years from now, or a $20,000 portfolio of stocks guaranteed to earn a compound annual average rate of return of 10.4 percent per year for the next 10 years. Determine the better alternative based solely on this information. ional Problems 6- Assume that we know the performance of the S&P 500 Index for the first five years of the second decade of the 21st century, defined as 2010-2019. What annual geometric mean must the market average for the last five years (2015-2019) to produce an over- all geometric mean for the decade of 10 percent? The returns for the first five years are 2010, 15.06 percent: 2011 9 9 percent; 2012, 16.1 percent; 2013, 19.7 percent; and140 CHAPTER 6 THE RETURNS AND RISKS FROM INVESTING TABLE 6-1 (continued) Year Index Value Dividend Return (%) Year Index Value Dividend Return (%) 1968 103.86 3.07 10.84 1992 435.71 12.38 7.43 -8,32 1993 12.58 9.94 1969 92.06 3.16 466.45 1970 92.15 3.14 3.51 1994 459.27 13.18 1.29 1971 102.09 3.07 14.12 995 615.93 13.79 37.11 1972 1 18.05 3.15 8.72 1996 740.74 14.90 22.68 1973 97.55 3.38 -14.50 1997 970.43 15.50 33.10 1974 68.56 3.60 -26.03 1998 229.23 16.20 28.34 1975 90.19 3.68 36.92 1999 1469 . 25 16.48 20.87 1976 107.46 4.05 23.64 2000 1320.28 16.27 -9.03 977 95.1 4.67 -7.16 2001 1 148.08 15.74 -11.85 1978 96.11 5.07 6.39 2002 879.82 16.07 -21.97 1979 107.94 5.65 18.19 2003 1111.92 17.39 28.36 1980 135.76 6.16 31.48 2004 121 1.92 19.44 10.74 1981 122.55 6.63 -4.85 2005 1248.29 22.22 4.83 1982 140.64 6.87 20.37 2006 1418.3 24.88 15.6 1983 164.93 7.09 22.31 2007 1468.36 27.73 5.48 984 167.24 7.53 5.97 2008 903.25 28.39 -36.55 1985 21 1.28 7.90 31.06 2009 1 115.1 22.41 25.94 1986 242.17 3.28 18.54 2010 1257.64 22.73 14.82 987 247.08 8.81 5.67 2011 1257.6 26.43 2.10 1988 277.72 9.73 16.34 2012 1426.19 31.25 15.89 1989 353.4 1 1.05 31.23 2013 1848.36 34.99 32.05 990 330.22 12.10 -3.14 2014 20589 39.44 13.52 1991 417.09 2.20 30.00 otal Return In summary, the TR concept, which is tradition- it is all-irCHAPTER 6 THE RETURNS AND RISKS FROM INVESTING TABLE 6-6 Summary Statistics of Annual Returns for Major Financial Assets for 85 Years, January 1. 1926-December 31, 2010 Arithmetic Geometric Mean Std. Dev. Mean Returns summary S&P 500 Composite 1 1.5% 19.9% 9.6% Aaa Corporate Bond 6.3 8.5 US Treasury Bond 5.9 5.8 9.2 Treasury bill 3.7 5.4 Inflation 3.0 3.1 3.6 4.2 Source: Jack W. Wilson and Charles P. Jones. 3.0 therefore, the difference between their geometric and arithmetic means is greater. Equation 6- reveals why there is a large difference between the geometric and arithmetic means for small considered in Table 6-6. common stocks. Small stocks have by far the largest variability of any of the returns series Corporate and Treasury bonds have geometric means that are roughly 50 to 60 percent of the S&P 500, at 5.9 and 5.4 percent, respectively, but the risk is cor Standard deviations for the bond series are less than half Finally, as expected, T-bills have the. in Table 6-6 36