Hello,
I am looking to create 2 functions to satisfy these requirements
(They can be polynomial of degree 3 or higher, exponential, logarithmic, or trigonometric function)
-The first function must start from below or middle and go up in the end, representing the increase amount of customer purchasing the products as time goes on steadily, please include x and y. (timeline from 1950 to 2050)
-Second function first will go up and decrease slowly as purchasing the products will help decrease environmental damage.
The timeline will be from 1950 to 2050. Please include x and y ( amount of products sold, year) and (products sold, amount of Microplastic)
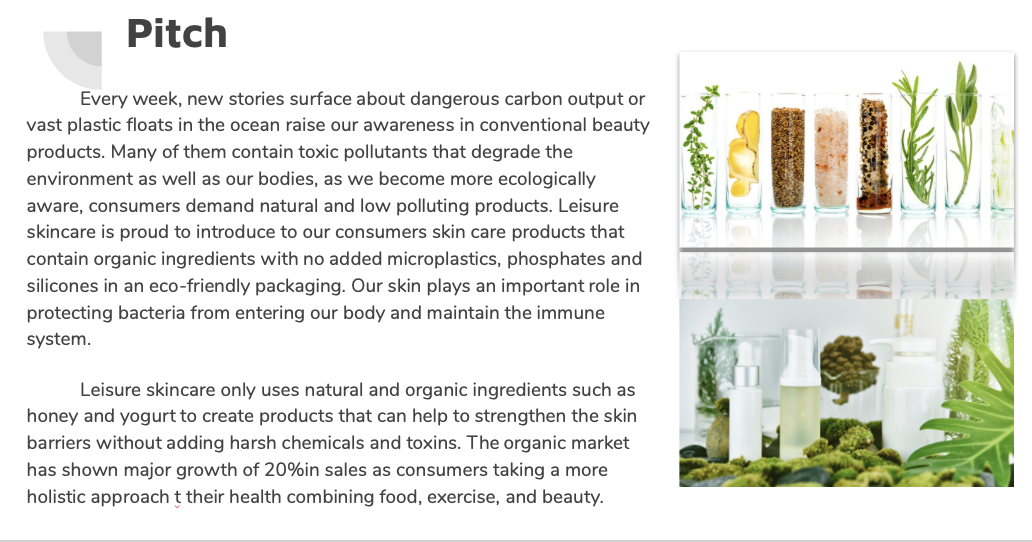
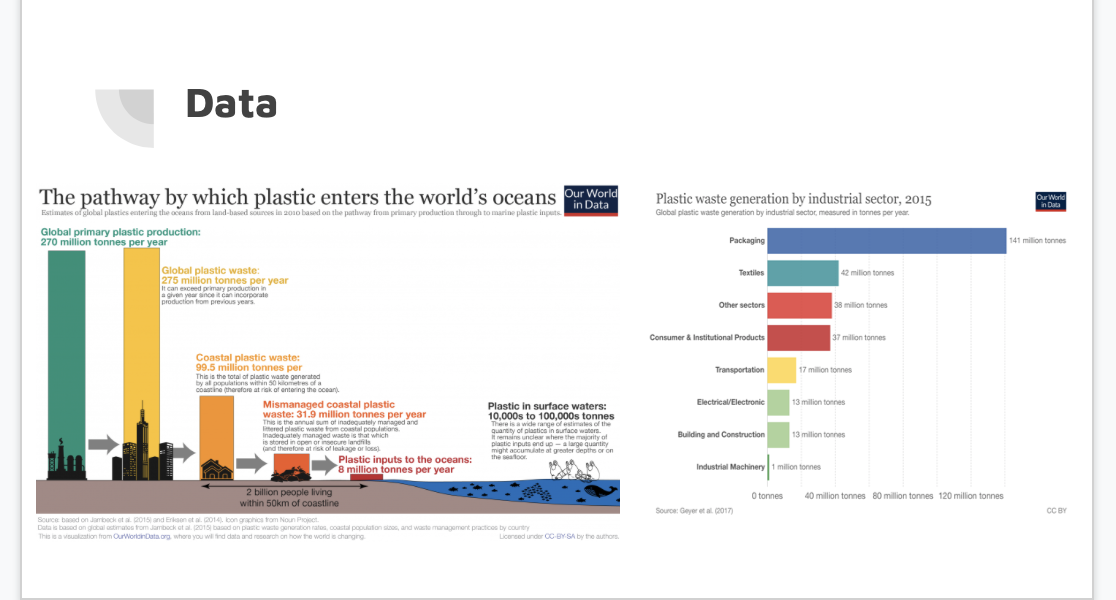
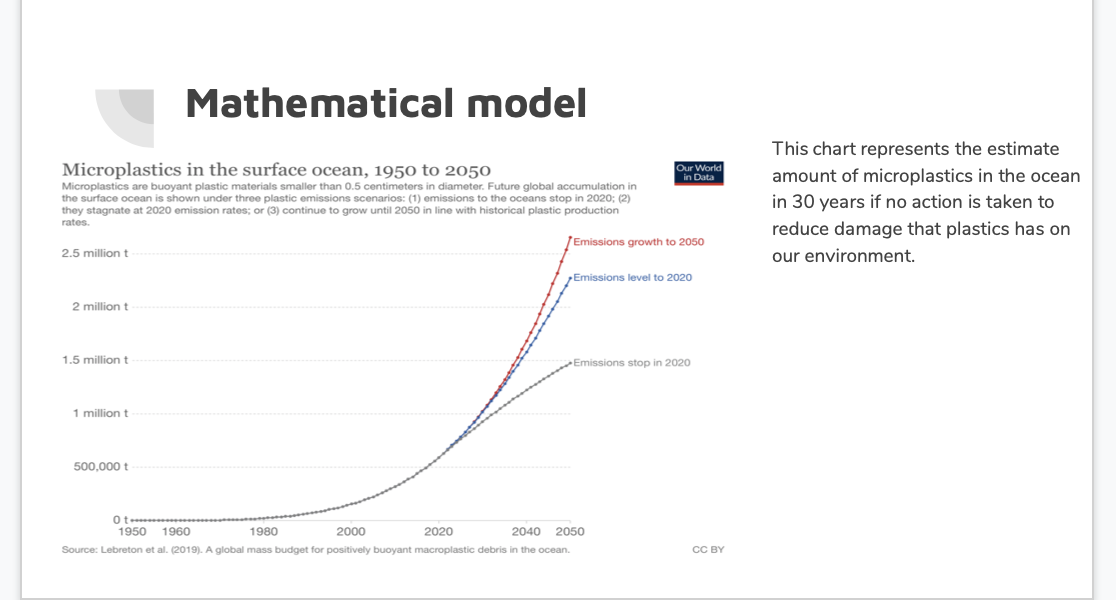
.__ Pitch Every week, new stories surface about dangerous carbon output or vast plastic floats in the ocean raise our awareness in conventional beauty products. Many of them contain toxic pollutants that degrade the environment as well as our bodies, as we become more ecologically aware, consumers demand natural and low polluting products. Leisure skincare is proud to introduce to our consumers skin care products that contain organic ingredients with no added microplastics, phosphates and silicones in an eco-friendly packaging. Our skin plays an important role in protecting bacteria from entering our body and maintain the immune system. Leisure skincare only uses natural and organic ingredients such as honey and yogurt to create products that can help to strengthen the skin barn'ers without adding harsh chemicals and toxins. The organic market has shown major growth of 20%in sales as consumers taking a more holistic approach '5 their health combining food, exercise. and beauty. Data The pathway by which plastic enters the world's oceans Our World Our World Estimates of global plastics entering the oceans from land-based sources in 2010 based on the pathway from primary production through to marine plastic inputs in Data Plastic waste generation by industrial sector, 2015 in Daity Global plastic waste generation by industrial sector, measured in tonnes per year. Global primary plastic production: 270 million tonnes per year Packaging 41 million tonnes Global plastic waste: Textiles 12 million tonnes 275 million tonnes per year It can exceed primary production in a grown year since it can incorporate production from previous years. Other sectors 18 million tonnes Consumer & Institutional Products 37 million tonnes Coastal plastic waste: 99.5 million tonnes per This is the total of plastic waste generated Transportation 17 milion tonnes by all populations within 50 kilometres of a coasting (therefore at risk of entering the conant. Mismanaged coastal plastic 13 million tonnes waste: 31.9 million tonnes per year Plastic in surface waters: Electrical/Electronic This is the annual sum of inadequately managed and 10,000s to 100,000s tonnes littered plastic waste from coastal populations. There is a wide range of estimates of the Inadequately managed waste is that which quantity of plastics in suitabe wa is stored in open or insecure landfilly It remains unclear where the majority of Building and Construction 13 million tonnes and therefore at risk of leakage or loss) plastic inputs and up - a large quantity might accumulate at greater depthe or on Plastic inputs to the oceans: the seafloor 8 million tonnes per year Industrial Machinery 1 milion tonnes 2 billion people living within 50km of coastline 0 tonnes 40 million tonnes 80 million tonnes 120 million tonnes Source: Geyer et al (2017) CC BY Squice baggd on Jomback at AL (2015) and Enkson et al. (2014), boon graphics from Noun Project. Data is based on global estimates from Jambock at al. (2015) based on plastic waste generation ratios, coastal population sizes practices by country This is a vousization from OurWorkinData or where you will ind data and resource on how the world is charging Licensed undor CC.BY SA by the authors.Mathematical model This chart represents the estimate Microplastics in the surface ocean, 1950 to 2050 Our World Microplastics are buoyant plastic materials smaller than 0.5 centimeters in diameter. Future global accumulation in in Data amount of microplastics in the ocean the surface ocean is shown under three plastic emissions scenarios: (1) emissions to the oceans stop in 2020; (2) they stagnate at 2020 emission rates; or (3) continue to grow until 2050 in line with historical plastic production in 30 years if no action is taken to rates. reduce damage that plastics has on 2.5 million t Emissions growth to 2050 our environment. Emissions level to 2020 2 million t 1.5 million t Emissions stop in 2020 1 million t 500,000 t 1950 1960 1980 2000 2020 2040 2050 Source: Lebreton et al. (2019). A global mass budget for positively buoyant macroplastic debris in the ocean. CC BY


