

Question
Hello, I am trying to make a histogram on excel from frequency distribution. My bin numbers are 0, 500, 1000, 1500, 2000, 2500, and 3000
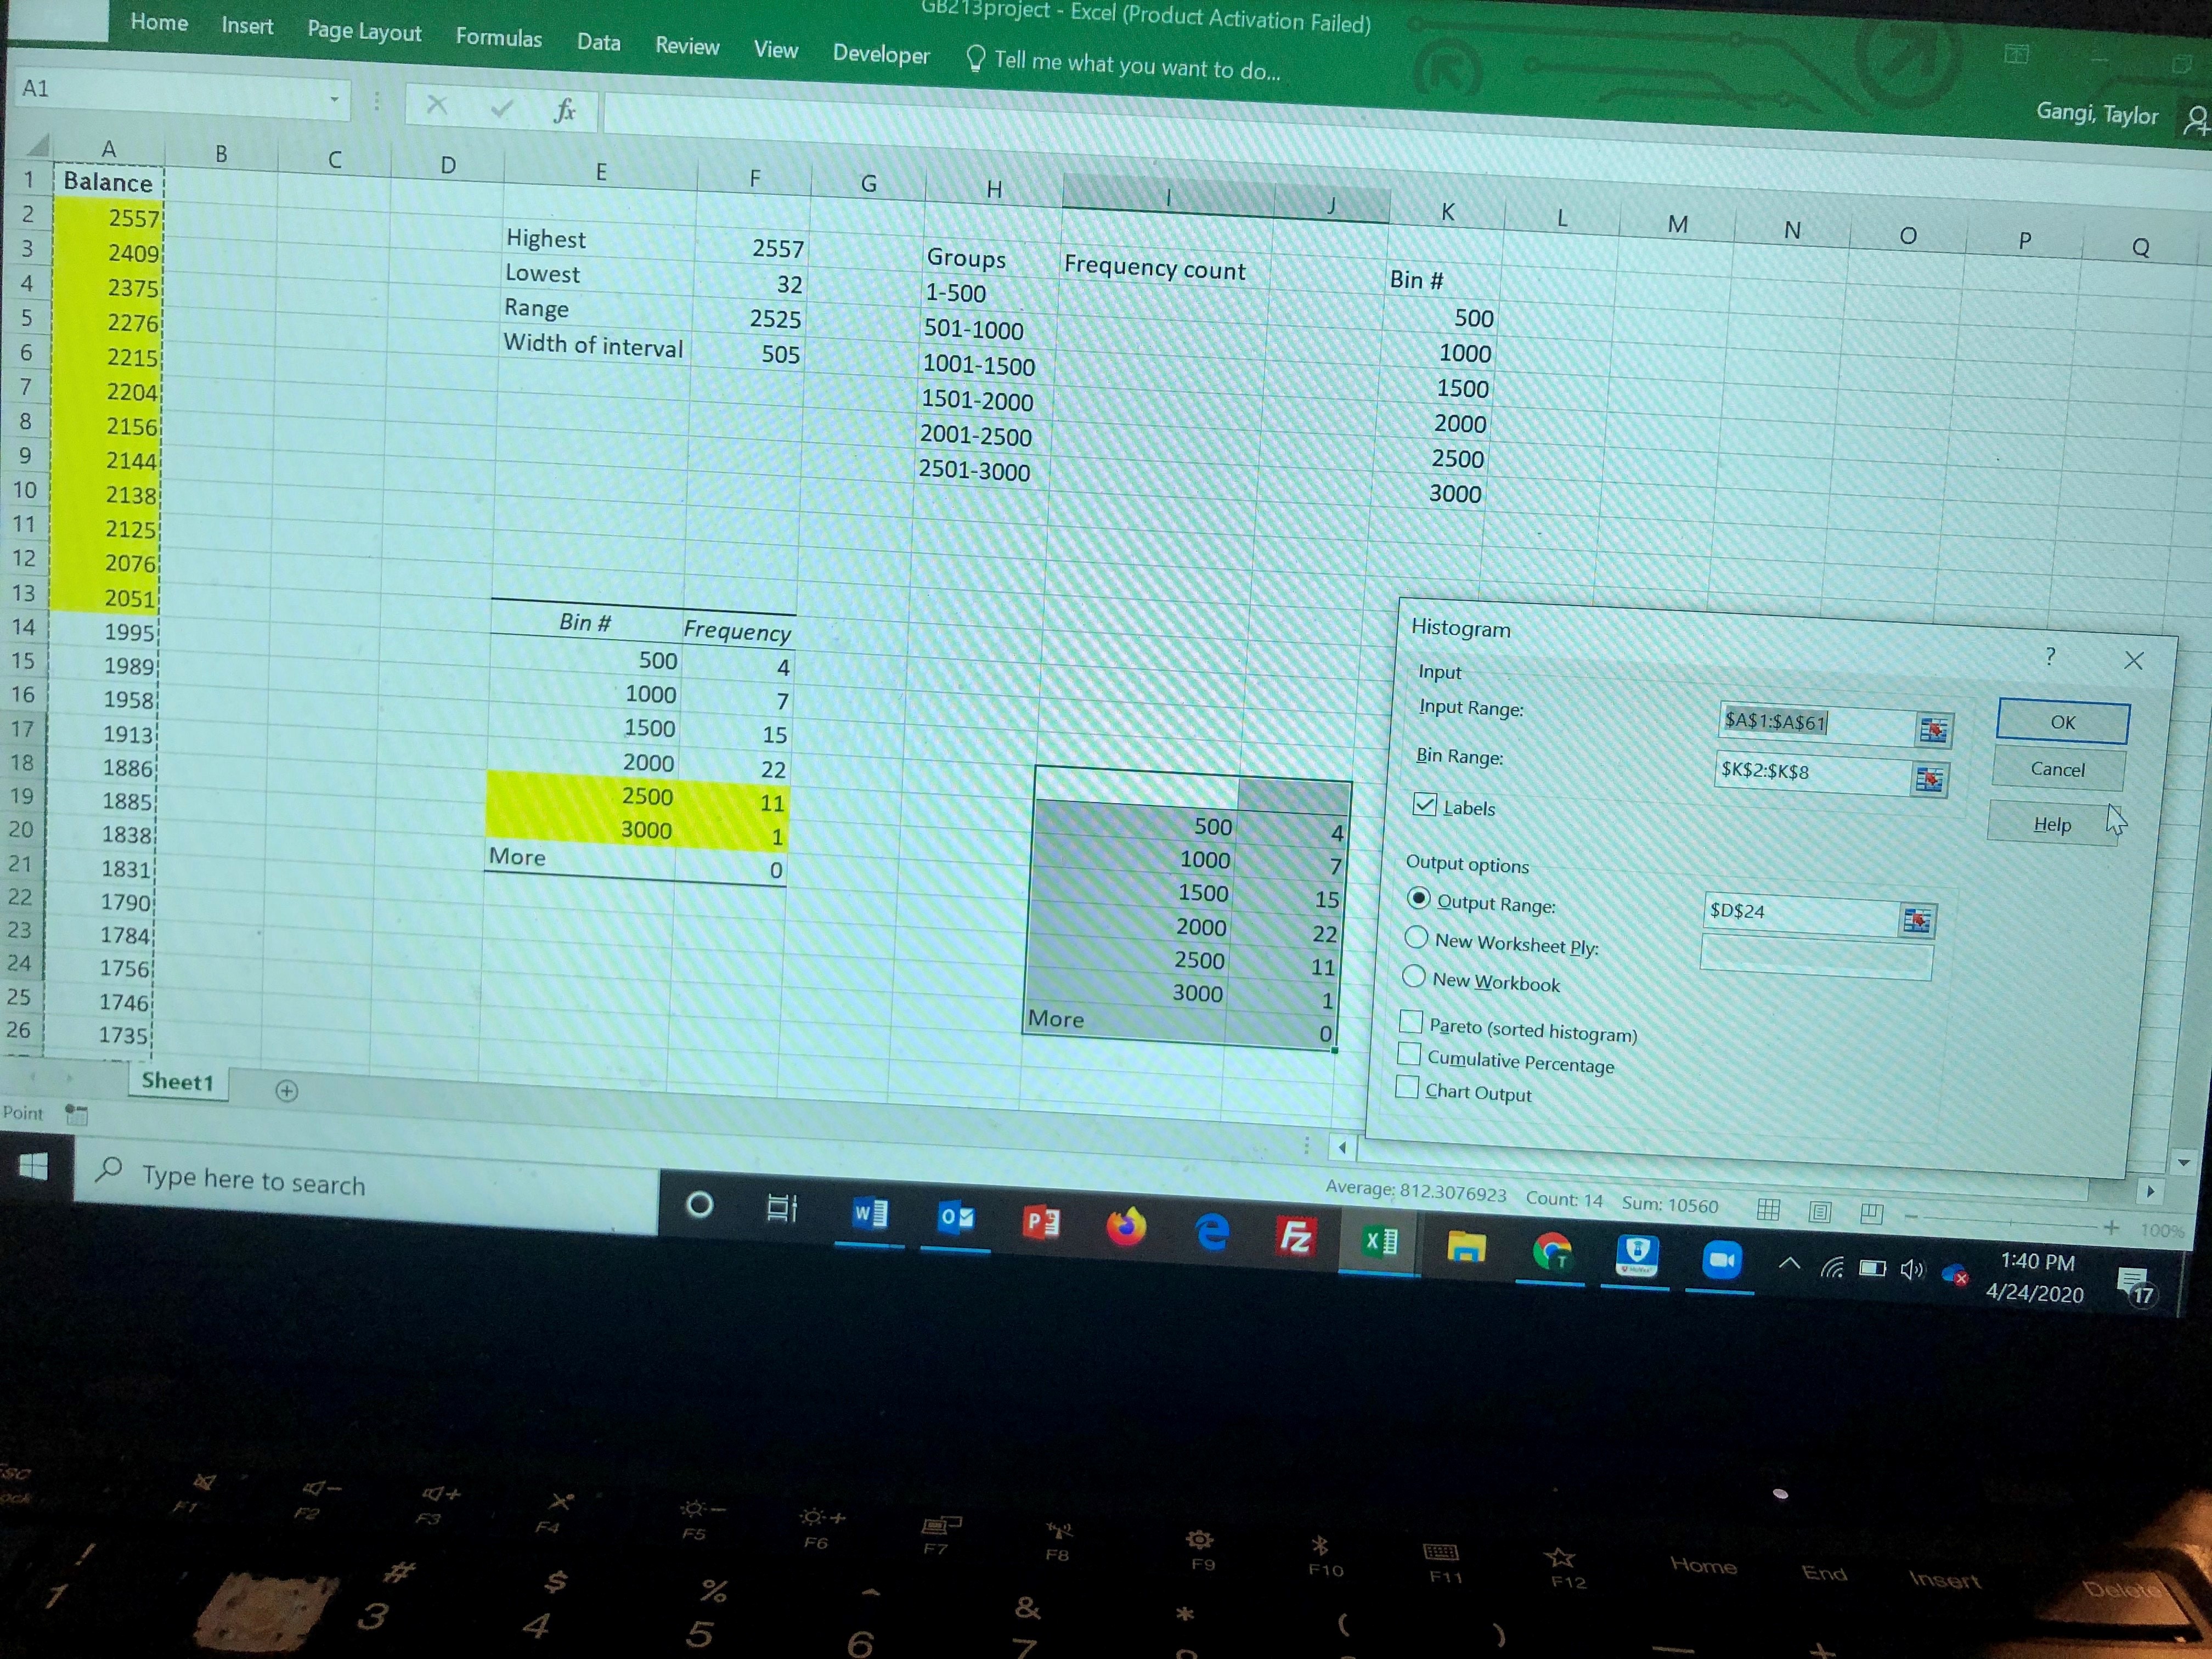
Hello, I am trying to make a histogram on excel from frequency distribution. My bin numbers are 0, 500, 1000, 1500, 2000, 2500, and 3000 and the corresponding frequencies are 4, 7, 15, 22, 11, and 1. I have already tried selecting the data analysis tool and clicking on the histogram option but a graph never showed up, and instead the chart I highlighted in gray pops up. How can I fix this?
Step by Step Solution
There are 3 Steps involved in it
Step: 1

Get Instant Access to Expert-Tailored Solutions
See step-by-step solutions with expert insights and AI powered tools for academic success
Step: 2

Step: 3
Ace Your Homework with AI
Get the answers you need in no time with our AI-driven, step-by-step assistance
Get Started
Essential Calculus Early Transcendental Functions
Authors: Ron Larson, Robert P. Hostetler, Bruce H. Edwards
1st Edition
618879188, 618879182, 978-0618879182