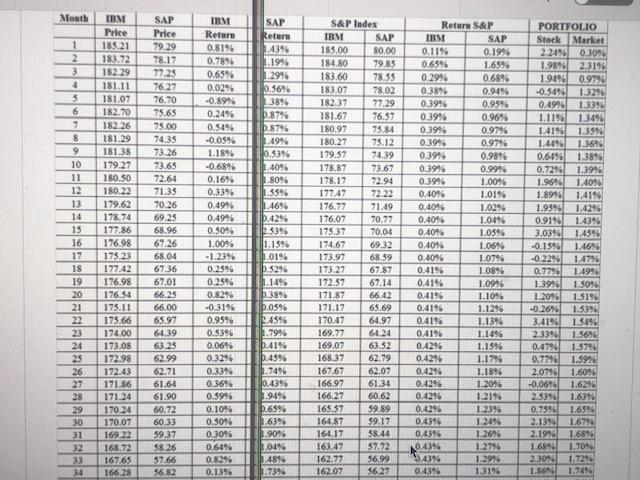
 Hello, I do not understand clearly step 2 of 7 of chapter 9 problem 3SSQ of the principles of corporate finance (10th edition) book. Why are there two different price data for the index and the individual stock? Can you clear it up please? Therefore how are the ruturns on IBM and SAP on the S&P differ from the normal returns? Thanks
Meath 1 2 3 4 5 6 7 8 9 10 11 12 IBM Price 185.21 183,72 182.29 181.11 181.07 182.70 182.26 181.29 181.38 179.27 180.50 180.22 179.62 178.74 177.86 176.98 175.23 177.42 176.98 176.54 175.11 175.66 174.00 173.08 172.98 172.43 171.86 171.24 170.24 170.07 169 22 165.72 167.65 166.28 14 IS 16 17 18 19 20 21 22 23 24 25 26 27 28 29 30 31 32 33 34 SAP Price 79.29 78.17 7725 76.27 76.70 75.65 75.00 74.35 73.26 73.65 72.64 71.35 70.26 69.25 68.96 6726 68.04 67.36 67,01 66.25 66.00 65.97 64.39 63.25 62.99 62.71 61.64 61.90 60.72 60.33 59,37 58.26 57.66 56.82 IBM Retur 0.8194 0.78% 0.65%6 0.02% -0.8996 0.2496 0.5496 -0.05% 1.18% -0.689 0.16% 0.33% 0.4996 0.4996 0.50% 1.0094 - 1.2394 0.2596 0.25% 0.8296 -0.3196 0.9596 0.53% 0.06% 0.3296 0.33% 0.36% 0.5996 0.1096 0.50% 0.3096 0.6496 0.8296 0.1396 SAP Return 1.4394 1.1946 12996 0.56% 13896 2.8796 5.8796 .4996 0.53% 9.4096 .8096 .53% 1.46% 0.42% 5396 1.15% 1.019 .8296 1.149 0.3896 0.0596 3.4596 7996 0.419 5.4596 1.7496 0.4396 1.9496 5.6596 1.6395 1.90% 1.0496 1.4846 1.73% S&P Index IBM SAP 185.00 80.00 184.80 79.85 183.60 78.55 183.07 78.02 18237 77.29 181.67 76.57 180.97 75 84 180.27 75.12 179.57 74.39 178.87 73.67 178.17 72.94 177.47 72.22 176.77 71.49 176.07 70.77 175 70.04 174,67 6932 173.97 68.59 173.27 67.87 172.37 67.14 171.87 66.42 171.17 65.69 170.47 64.97 169.72 64.24 169.07 63.52 168.37 62.79 167,67 62.07 166.97 6134 166.27 60.62 165.57 59.89 164.87 59.17 164.17 58.44 163.47 5772 162.77 56.99 162.07 56.27 MEN. Return S&P IEM SAP 0.1196 0.1995 0.65% 1.65% 0.2996 0.6895 0.38% 0.94% 0.3996 0.95% 0.3996 0.96% 0.3994 0.97% 0.3996 0.9796 0.396 0.98% 0.39% 0.9996 0.3996 1.00% 0.40% 1.01% 0.40% 1.029 0.40% 1.04% 0.4096 1.03% 0.40% 1.06% 0.404 1.0796 0.419 1.08% 0.41% 1.0996 0.419 1.1095 0.4196 1.1296 0.4196 1.13% 0.4196 1.1496 0.4296 1.1995 0.4296 1.17% 0.4296 1.1896 0.4296 1.2005 0.4296 1.219 0.4296 1.2325 0.439 1.24% 0.4396 1.26% 0.4396 1.2796 4396 1.1996 0.4396 1.3196 PORTFOLIO Stock Market 2.2495 0.30% 1.98981 2.3196 1.9496 0.979 -0.54% 1.32% 0.4995 1.3394 1.1196 1.3496 14196 1.3596 1.4496 1.36% 0.64% 1.3895 0.72% 1.3994 1.9696 1.40% 1.8994 1.4196 1.95% 1.4296 0.9196 1.4396 3.0396 1.459 -0.1596 1.46% -0.2296 1.4796 0.7796 1.494 1.39% 1.50% 1.2096 1.5196 -0.26% 1.3390 3.4194 1.5896 2.3396 1.56% 0.4796 1.5796 0.77% 1.399 2.0796 1.6096 -0.06% 1.6296 2.5396 1.6394 0.75941 1.65 2.1396 1.67% 2.1990 1689 1.6844 1.7044 2.3094 1.721 1.864 1.749 LEILI LILILLED . Meath 1 2 3 4 5 6 7 8 9 10 11 12 IBM Price 185.21 183,72 182.29 181.11 181.07 182.70 182.26 181.29 181.38 179.27 180.50 180.22 179.62 178.74 177.86 176.98 175.23 177.42 176.98 176.54 175.11 175.66 174.00 173.08 172.98 172.43 171.86 171.24 170.24 170.07 169 22 165.72 167.65 166.28 14 IS 16 17 18 19 20 21 22 23 24 25 26 27 28 29 30 31 32 33 34 SAP Price 79.29 78.17 7725 76.27 76.70 75.65 75.00 74.35 73.26 73.65 72.64 71.35 70.26 69.25 68.96 6726 68.04 67.36 67,01 66.25 66.00 65.97 64.39 63.25 62.99 62.71 61.64 61.90 60.72 60.33 59,37 58.26 57.66 56.82 IBM Retur 0.8194 0.78% 0.65%6 0.02% -0.8996 0.2496 0.5496 -0.05% 1.18% -0.689 0.16% 0.33% 0.4996 0.4996 0.50% 1.0094 - 1.2394 0.2596 0.25% 0.8296 -0.3196 0.9596 0.53% 0.06% 0.3296 0.33% 0.36% 0.5996 0.1096 0.50% 0.3096 0.6496 0.8296 0.1396 SAP Return 1.4394 1.1946 12996 0.56% 13896 2.8796 5.8796 .4996 0.53% 9.4096 .8096 .53% 1.46% 0.42% 5396 1.15% 1.019 .8296 1.149 0.3896 0.0596 3.4596 7996 0.419 5.4596 1.7496 0.4396 1.9496 5.6596 1.6395 1.90% 1.0496 1.4846 1.73% S&P Index IBM SAP 185.00 80.00 184.80 79.85 183.60 78.55 183.07 78.02 18237 77.29 181.67 76.57 180.97 75 84 180.27 75.12 179.57 74.39 178.87 73.67 178.17 72.94 177.47 72.22 176.77 71.49 176.07 70.77 175 70.04 174,67 6932 173.97 68.59 173.27 67.87 172.37 67.14 171.87 66.42 171.17 65.69 170.47 64.97 169.72 64.24 169.07 63.52 168.37 62.79 167,67 62.07 166.97 6134 166.27 60.62 165.57 59.89 164.87 59.17 164.17 58.44 163.47 5772 162.77 56.99 162.07 56.27 MEN. Return S&P IEM SAP 0.1196 0.1995 0.65% 1.65% 0.2996 0.6895 0.38% 0.94% 0.3996 0.95% 0.3996 0.96% 0.3994 0.97% 0.3996 0.9796 0.396 0.98% 0.39% 0.9996 0.3996 1.00% 0.40% 1.01% 0.40% 1.029 0.40% 1.04% 0.4096 1.03% 0.40% 1.06% 0.404 1.0796 0.419 1.08% 0.41% 1.0996 0.419 1.1095 0.4196 1.1296 0.4196 1.13% 0.4196 1.1496 0.4296 1.1995 0.4296 1.17% 0.4296 1.1896 0.4296 1.2005 0.4296 1.219 0.4296 1.2325 0.439 1.24% 0.4396 1.26% 0.4396 1.2796 4396 1.1996 0.4396 1.3196 PORTFOLIO Stock Market 2.2495 0.30% 1.98981 2.3196 1.9496 0.979 -0.54% 1.32% 0.4995 1.3394 1.1196 1.3496 14196 1.3596 1.4496 1.36% 0.64% 1.3895 0.72% 1.3994 1.9696 1.40% 1.8994 1.4196 1.95% 1.4296 0.9196 1.4396 3.0396 1.459 -0.1596 1.46% -0.2296 1.4796 0.7796 1.494 1.39% 1.50% 1.2096 1.5196 -0.26% 1.3390 3.4194 1.5896 2.3396 1.56% 0.4796 1.5796 0.77% 1.399 2.0796 1.6096 -0.06% 1.6296 2.5396 1.6394 0.75941 1.65 2.1396 1.67% 2.1990 1689 1.6844 1.7044 2.3094 1.721 1.864 1.749 LEILI LILILLED
 Hello, I do not understand clearly step 2 of 7 of chapter 9 problem 3SSQ of the principles of corporate finance (10th edition) book. Why are there two different price data for the index and the individual stock? Can you clear it up please? Therefore how are the ruturns on IBM and SAP on the S&P differ from the normal returns? Thanks


