

Question
Hello, I have a question regarding - Supply Chain Management 5th Edition, Chapter 7, Problem 2E: 'Weekly demand at Hot Pizza'. Estimate demand for the
Hello, I have a question regarding - Supply Chain Management 5th Edition, Chapter 7, Problem 2E: 'Weekly demand at Hot Pizza'. "Estimate demand for the next 4 weeks using a 4-week moving average as well as simple exponential smoothing with a = 0.1. Evaluate the MSW, MAD, MAPE, bias, and TS in each case. Which of the two methods is better? Why?" I have seen the guided step-by-step solution for this question and understand everything else discussed, but can not understand how bias has been calculated. Could you please explain how bias was calculated? I am of the understanding that it should be total error / number of periods. But when I do that calculation, it is not equal to 12.09 (for moving average) as per the solution guide or 16.43 (for simple exponential smoothing). So if you could tell me, perhaps in terms of which cells should be highlighted or used in a formula in excel or just explain the maths of how these figures were reached, I would be very grateful.
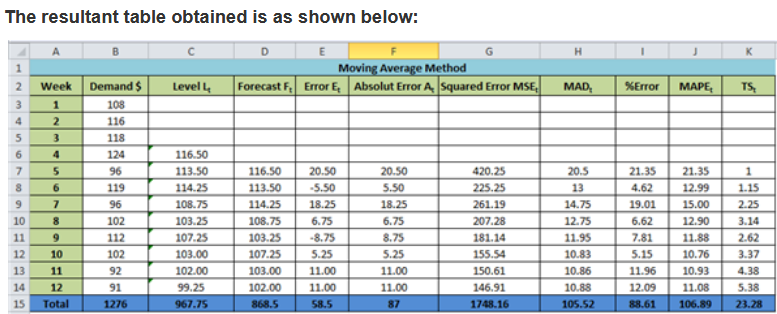
Please use the data from below data set to calculate bias for me step be step if at all possible (Data set is based on 4 week moving average). As I am still not understanding how the figure 12.09 for bias was calculated.
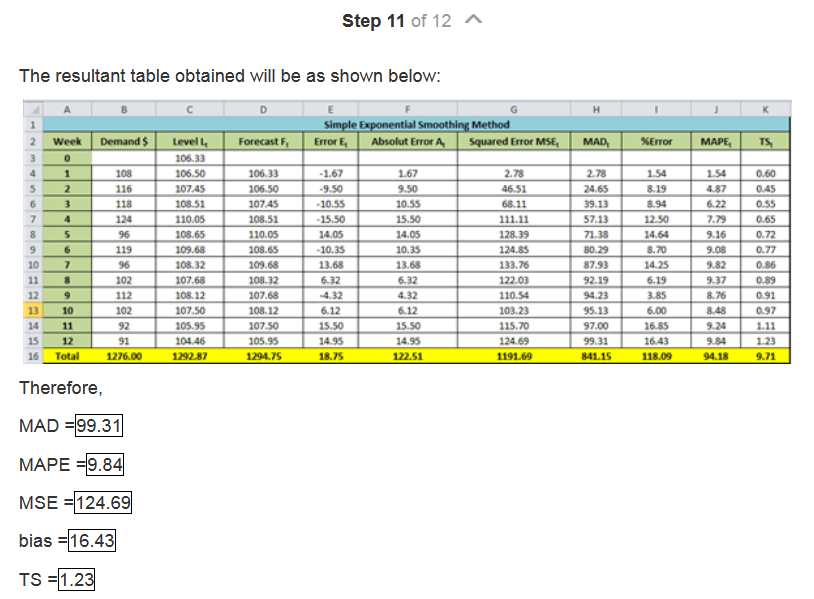
This second printscreen shows the data for Simple Exponential Smoothing, which i also don't understand how bias has been calculated for.
Step by Step Solution
There are 3 Steps involved in it
Step: 1

Get Instant Access to Expert-Tailored Solutions
See step-by-step solutions with expert insights and AI powered tools for academic success
Step: 2

Step: 3
Ace Your Homework with AI
Get the answers you need in no time with our AI-driven, step-by-step assistance
Get Started
Report Of Audit Resolution Questioned Costs Federal Superfund Program Department Of Health And Environmental Sciences 1994
Authors: Montana Dept Of Health And Environm
1st Edition
101924657X, 978-1019246573