Question
Hello, I have the spread sheet all filled out but I am having trouble figuring out questions 1-3 I have the F-35 for last name
Hello, I have the spread sheet all filled out but I am having trouble figuring out questions 1-3 I have the F-35 for last name m-z
Introduction
In this module, you explore the normal distribution. A standard normal distribution has a mean of zero and standard deviation of one. The z-score statistic converts a non-standard normal distribution into a standard normal distribution allowing us to use Table A-2 in your textbook and report associated probabilities.
This discussion combines means, standard deviation, z-score, and probability. You are encouraged to complete the textbook reading and start the MyStatLab Homework before starting this discussion.
Scenario
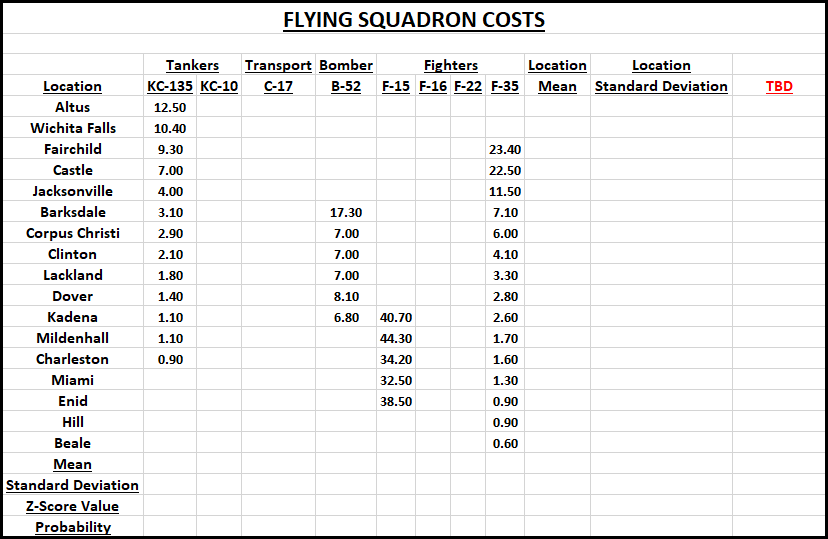
The following table reports simulated annual flying squadron costs (in millions of dollars) at the following locations:
Text description of the Annual Squadron Flying Costs in Millions (PDF)
Complete
Use Microsoft Excel and StatDisk to complete the Flying Squadron Costs table for the aircraft type listed below:
- If your last name begins with the letter A through L, complete the costs using the B-52data; use theKadenadata point in your z-score and probability calculations.
- If your last name begins with the letter M through Z, complete the costs using the F-35data; use the Charleston data point in your z-score and probability calculations.
Report your values to two decimal places (i.e., 0.12) except for probability. Report probability values to four decimal places (i.e. p = 0.1234).
Your StatDisk results should look similar to this image:
Save your work as separate files to your computer and then read the Canvas instructions onHow do I embed an imagein a discussion reply as a student?
(Links to an external site.)
Links to an external site.
Post & Discuss
Post the images of your spreadsheet and StatDisk results in the discussion area along with a narrative of your findings and the responses to the questions below.
- Do these costs appear to come from a population that has a normal distribution? Why or why not?
- Can the mean of your data sample be treated as a value from a population having a normal distribution? Why or why not?
- Did an "unusually low" or "unusually high" z-score value occur?
- Was the associated z score probability value less than 0.05 (p
- What were your findings? Hint: focus on the calculated mean, standard deviation and z-score (include probability) to interpret your results.
You should make your initial post before the fourth day of the module week to receive full credit. Return at least once later in the module week to provide meaningful comments to two or more of your classmates' posts. DO NOT "post and run" - making all three posts in the same visit. You need multiple visits to the discussion area to gain multiple perspectives by reading all of the posts and replies.
Review the Discussion Rubric for detailed grading information.

Step by Step Solution
There are 3 Steps involved in it
Step: 1

Get Instant Access to Expert-Tailored Solutions
See step-by-step solutions with expert insights and AI powered tools for academic success
Step: 2

Step: 3

Ace Your Homework with AI
Get the answers you need in no time with our AI-driven, step-by-step assistance
Get Started


