Hello. I hope you can help me figure this all out for a statistics class I am taking. Here are the directions:
This problem set introduces you to the use of SPSS for analyzing data with more than one IV and more than one DV to investigate comparison of means. You will perform a one-way between subjects MANOVA on the data and report your output.
General Requirements:
Use the following information to ensure successful completion of the assignment:
- Review "SPSS Access Instructions" for information on how to access SPSS for this assignment.
- Download "Module 8 Problem Set" and use it for this assignment.
Directions:
Perform the following tasks for this assignment:
- Conduct necessary analyses using SPSS so you can answer the questions listed in the exercise.
- Submit your responses to the exercise questions as a Word document.
- Submit the SPSS Output files showing the analyses you performed in SPSS to compute the answers for related questions. (Note: You will need to copy the SPSS file to a Word doc for submission.)
-----
I am attaching pics so you can see the tests, variables, etc. Thanks so much! *Update - Here is the SPSS data....Factorial (2 3) MANOVA
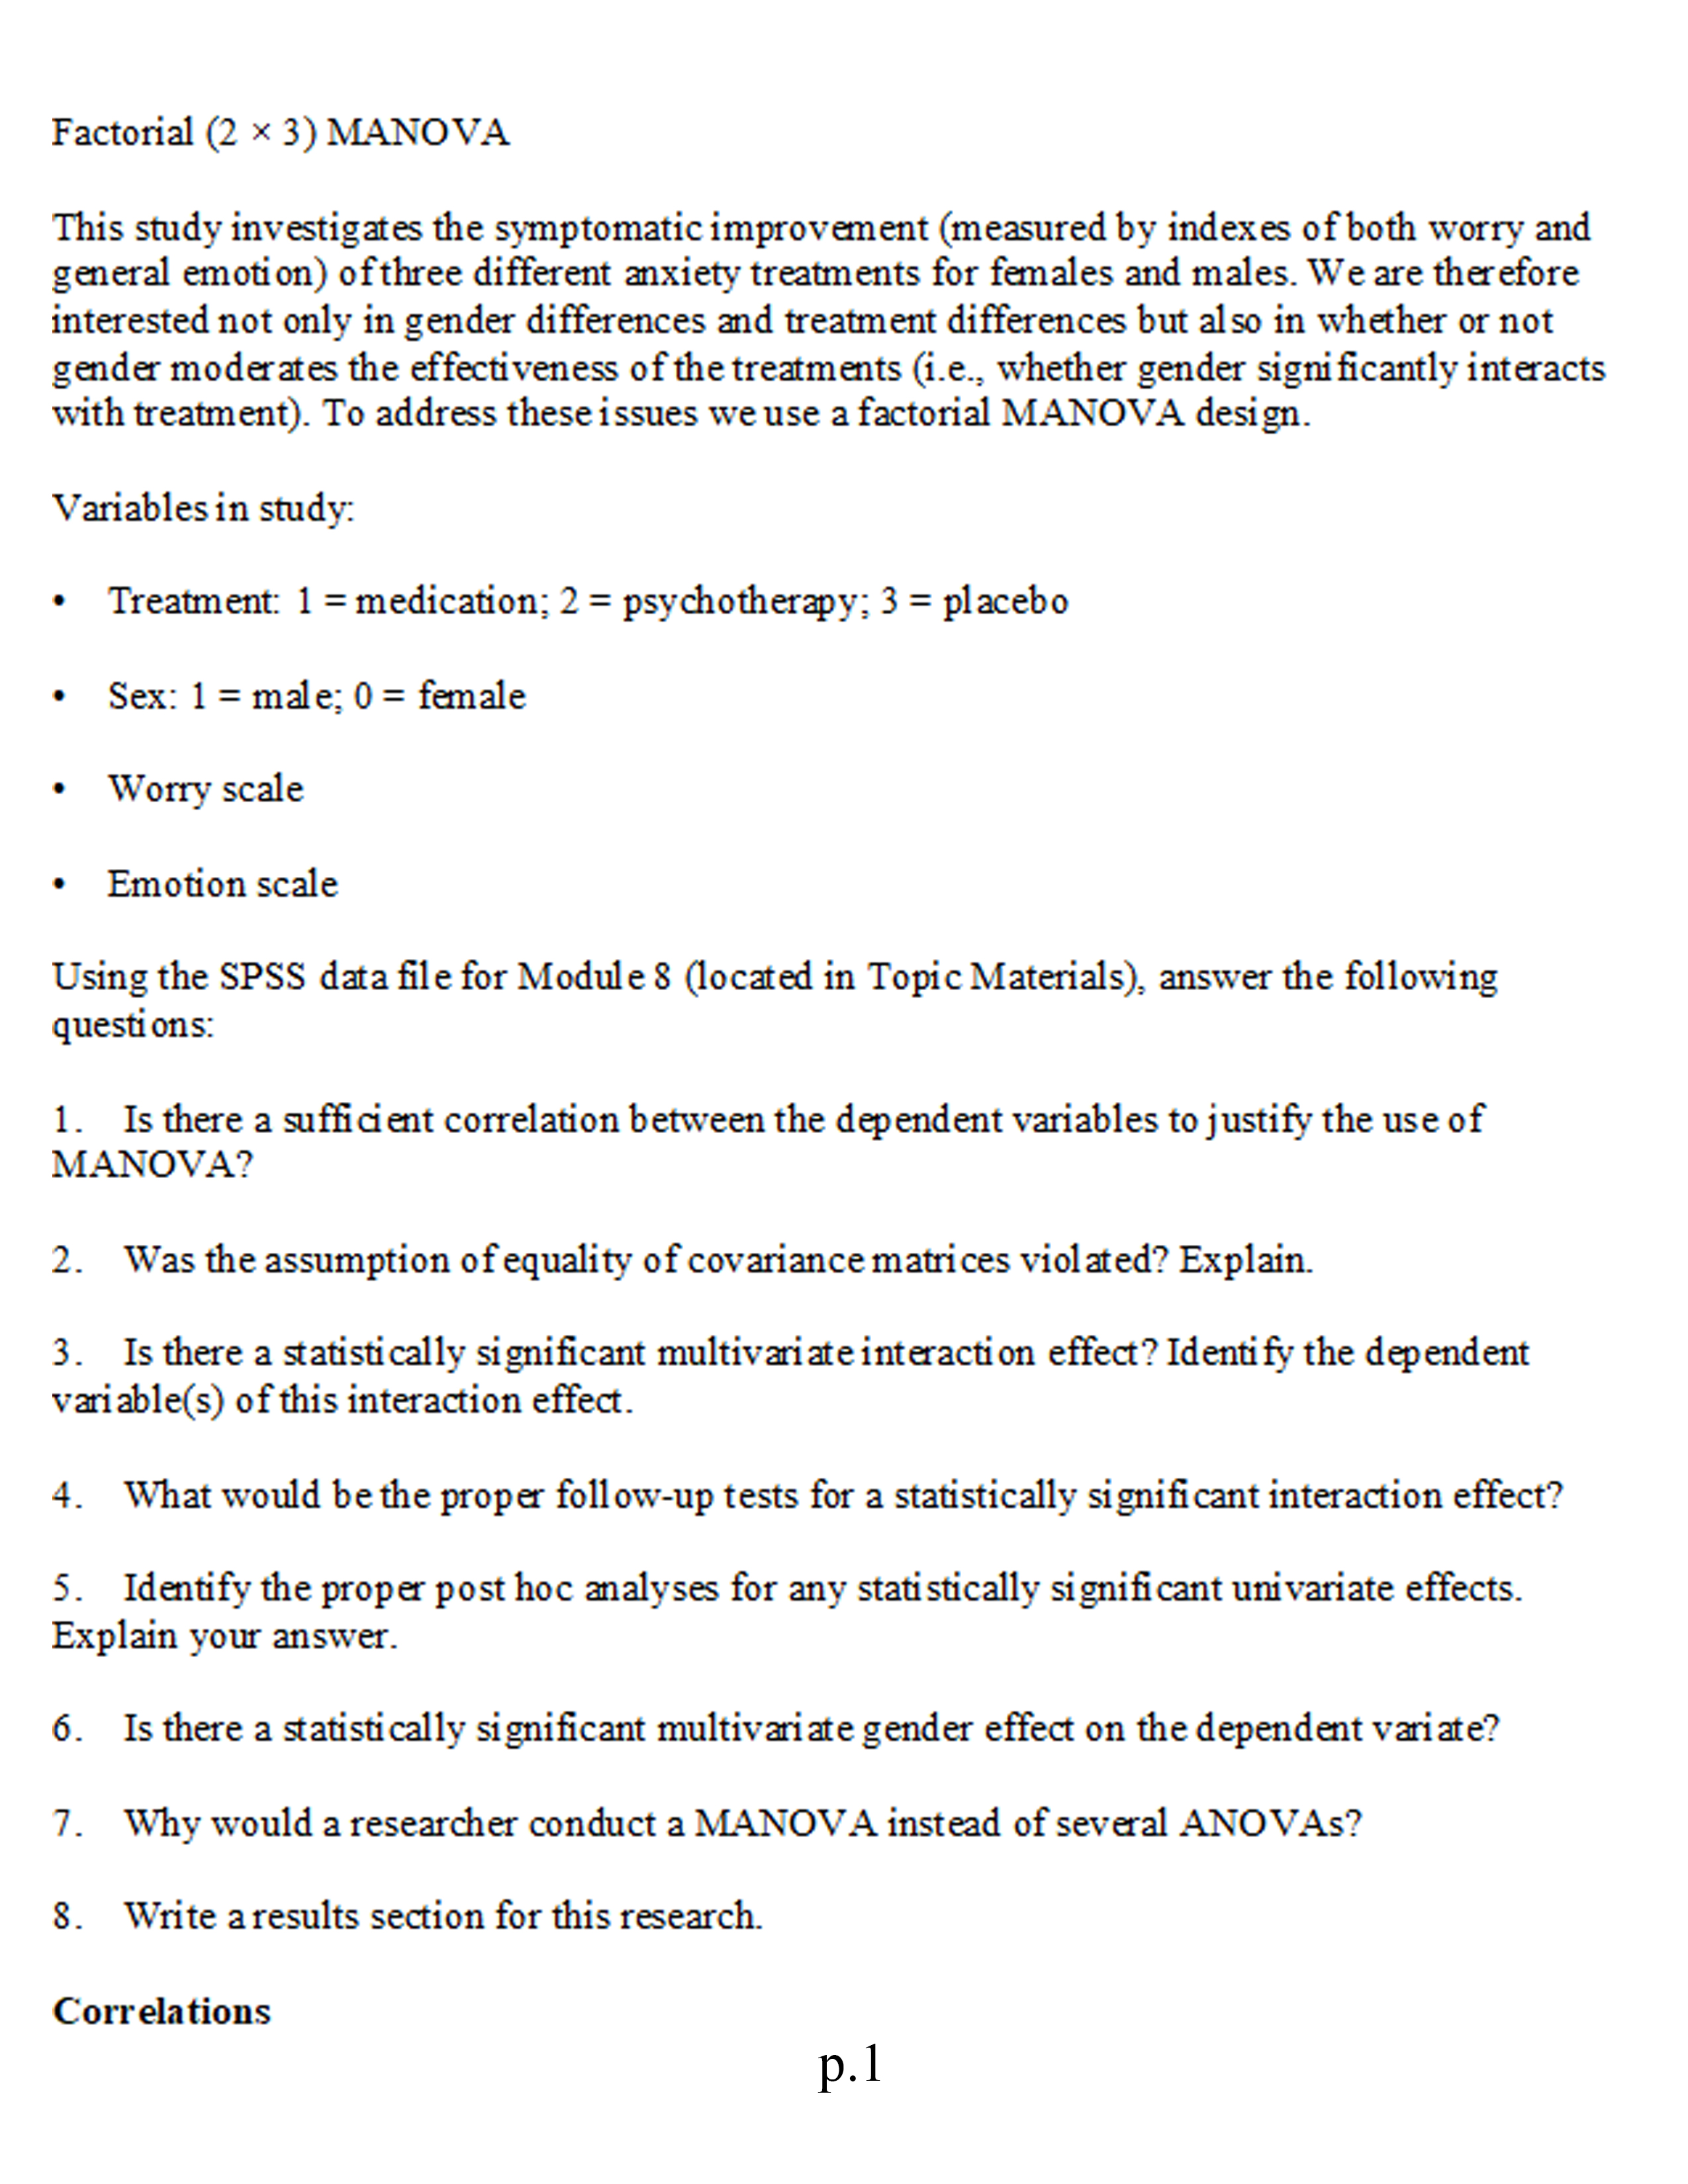
This study investigates the symptomatic improvement (measured by indexes of both worry and general emotion) of three different anxiety treatments for females and males. We are therefore interested not only in gender differences and treatment differences but also in whether or not gender moderates the effectiveness of the treatments (i.e., whether gender significantly interacts with treatment). To address these issues we use a factorial MANOVA design.
Variables in study:
Treatment: 1 = medication; 2 = psychotherapy; 3 = placebo
Sex: 1 = male; 0 = female
Worry scale
Emotion scale
Using the SPSS data file for Module 8 (located in Topic Materials), answer the following questions:
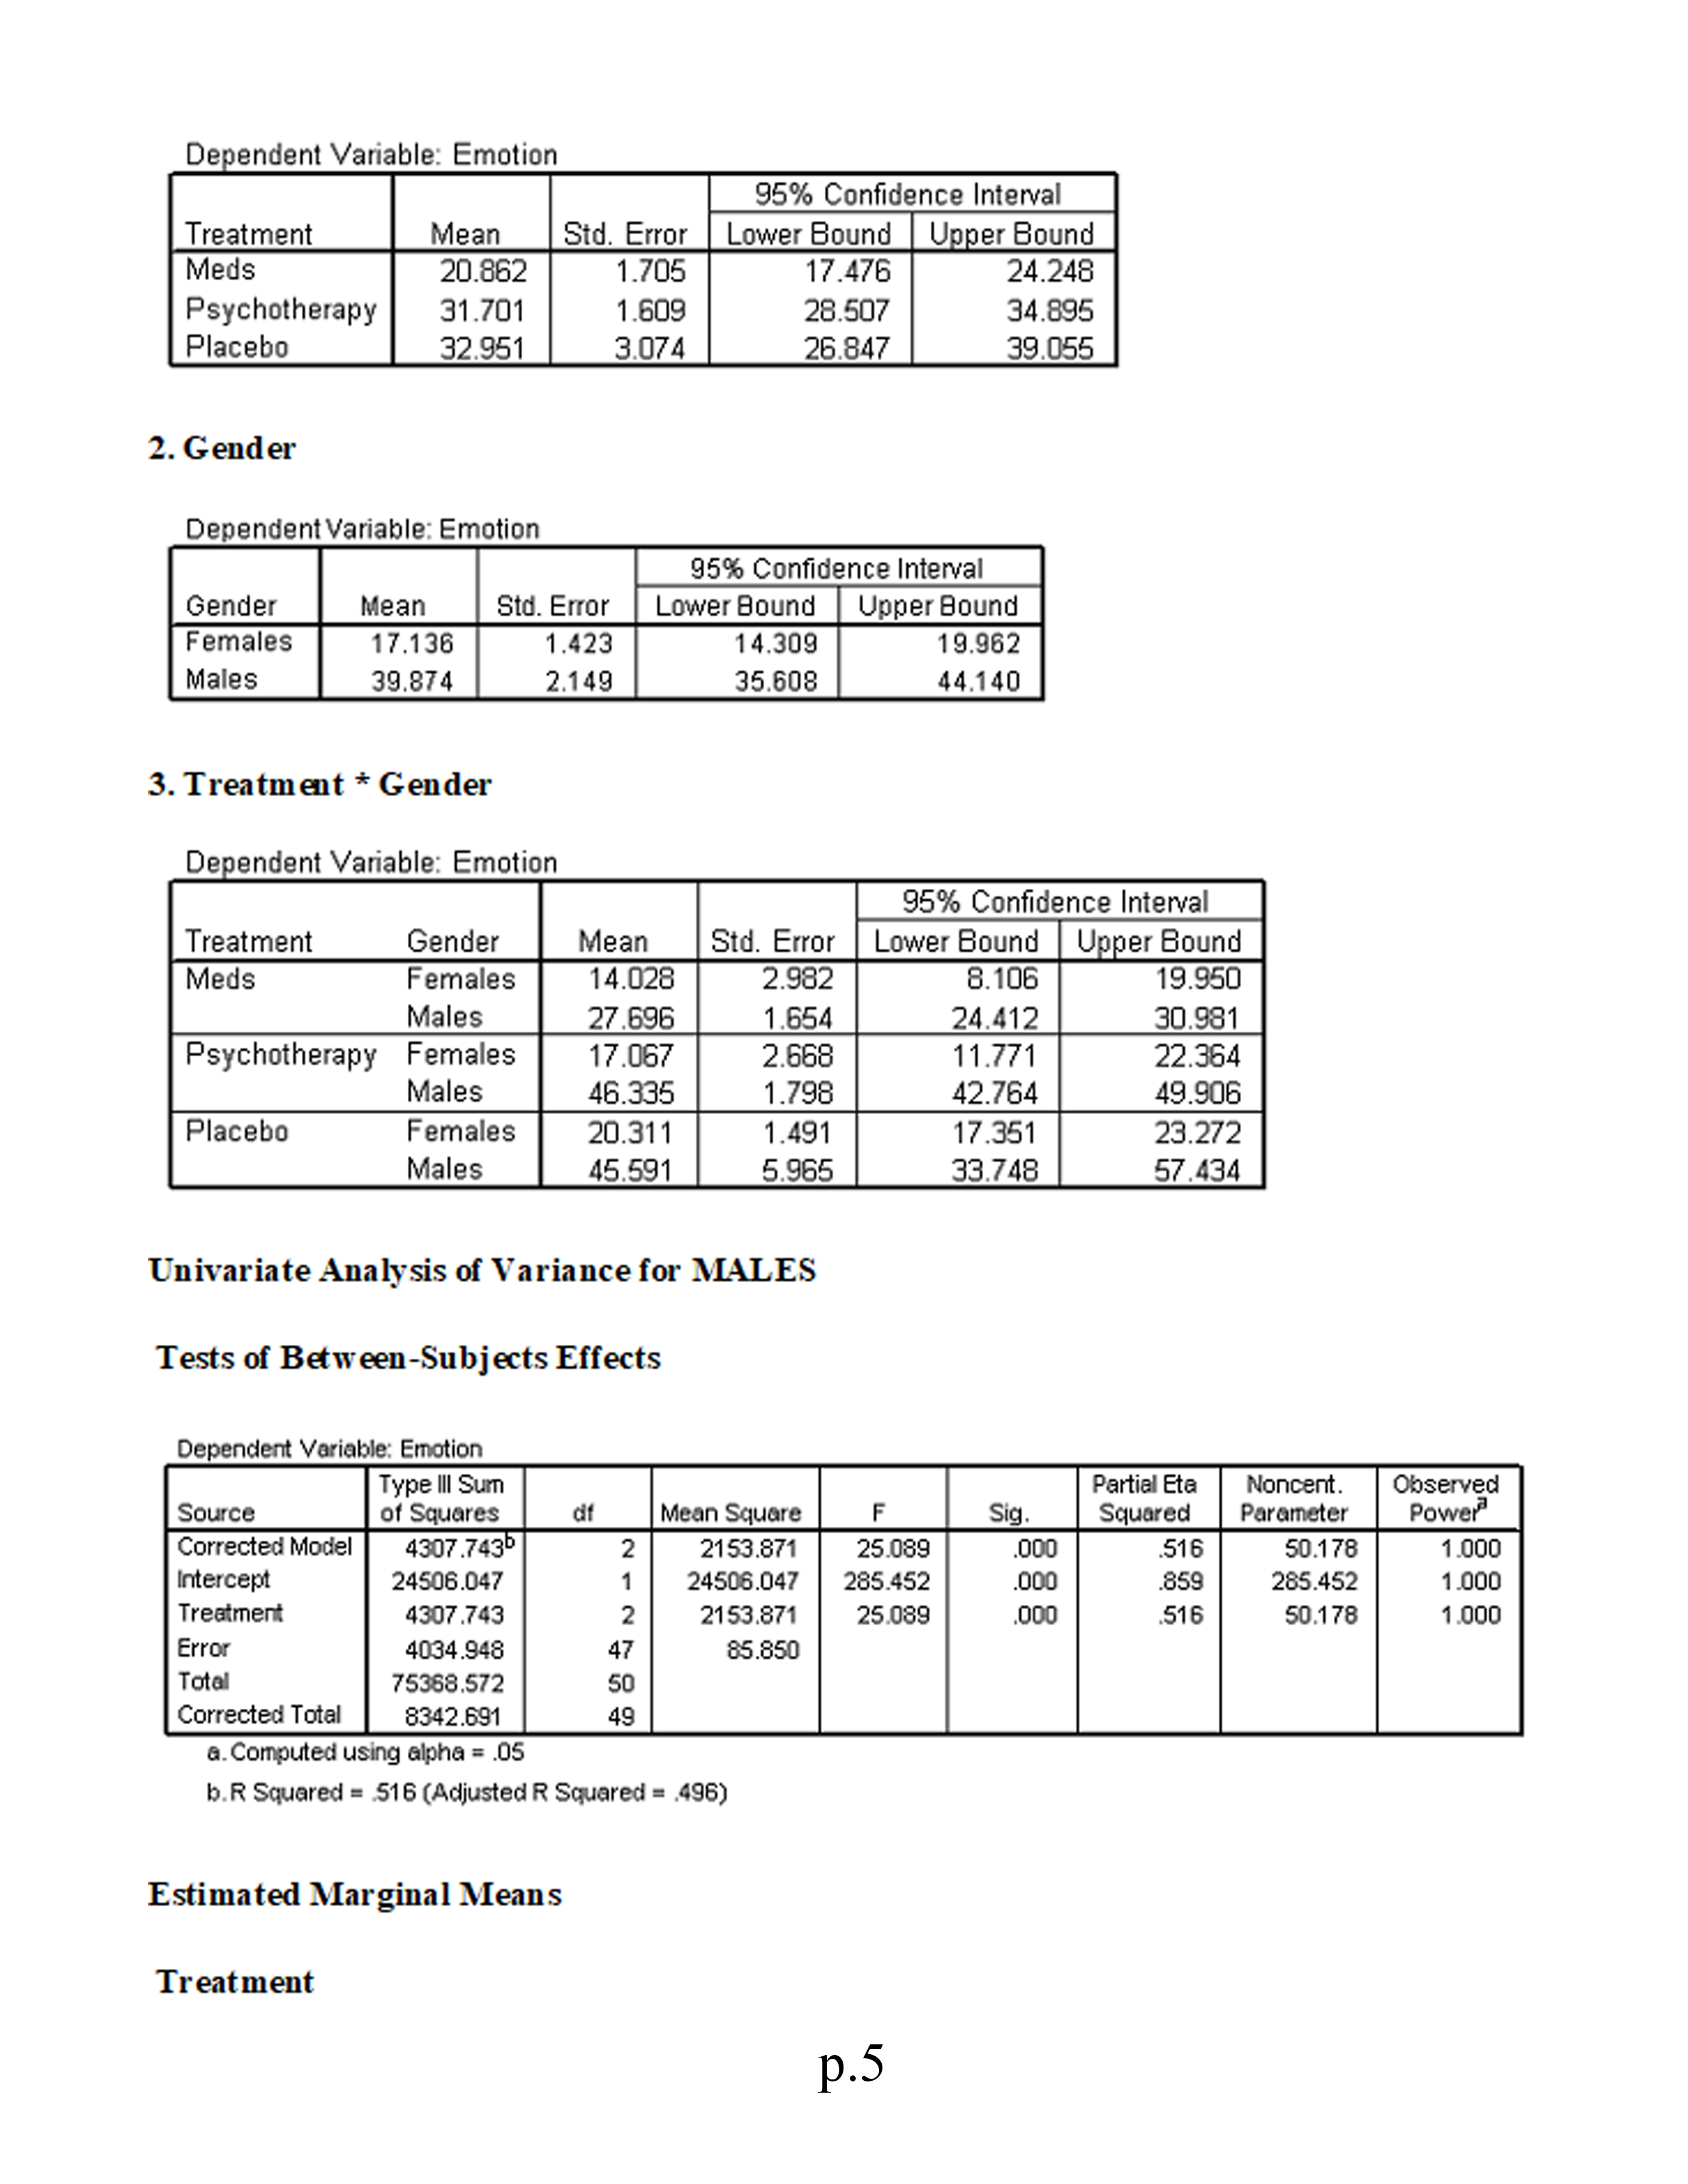
1.Is there a sufficient correlation between the dependent variables to justify the use of MANOVA?
2.Was the assumption of equality of covariance matrices violated? Explain.
3.Is there a statistically significant multivariate interaction effect? Identify the dependent variable(s) of this interaction effect.
4.What would be the proper follow-up tests for a statistically significant interaction effect?
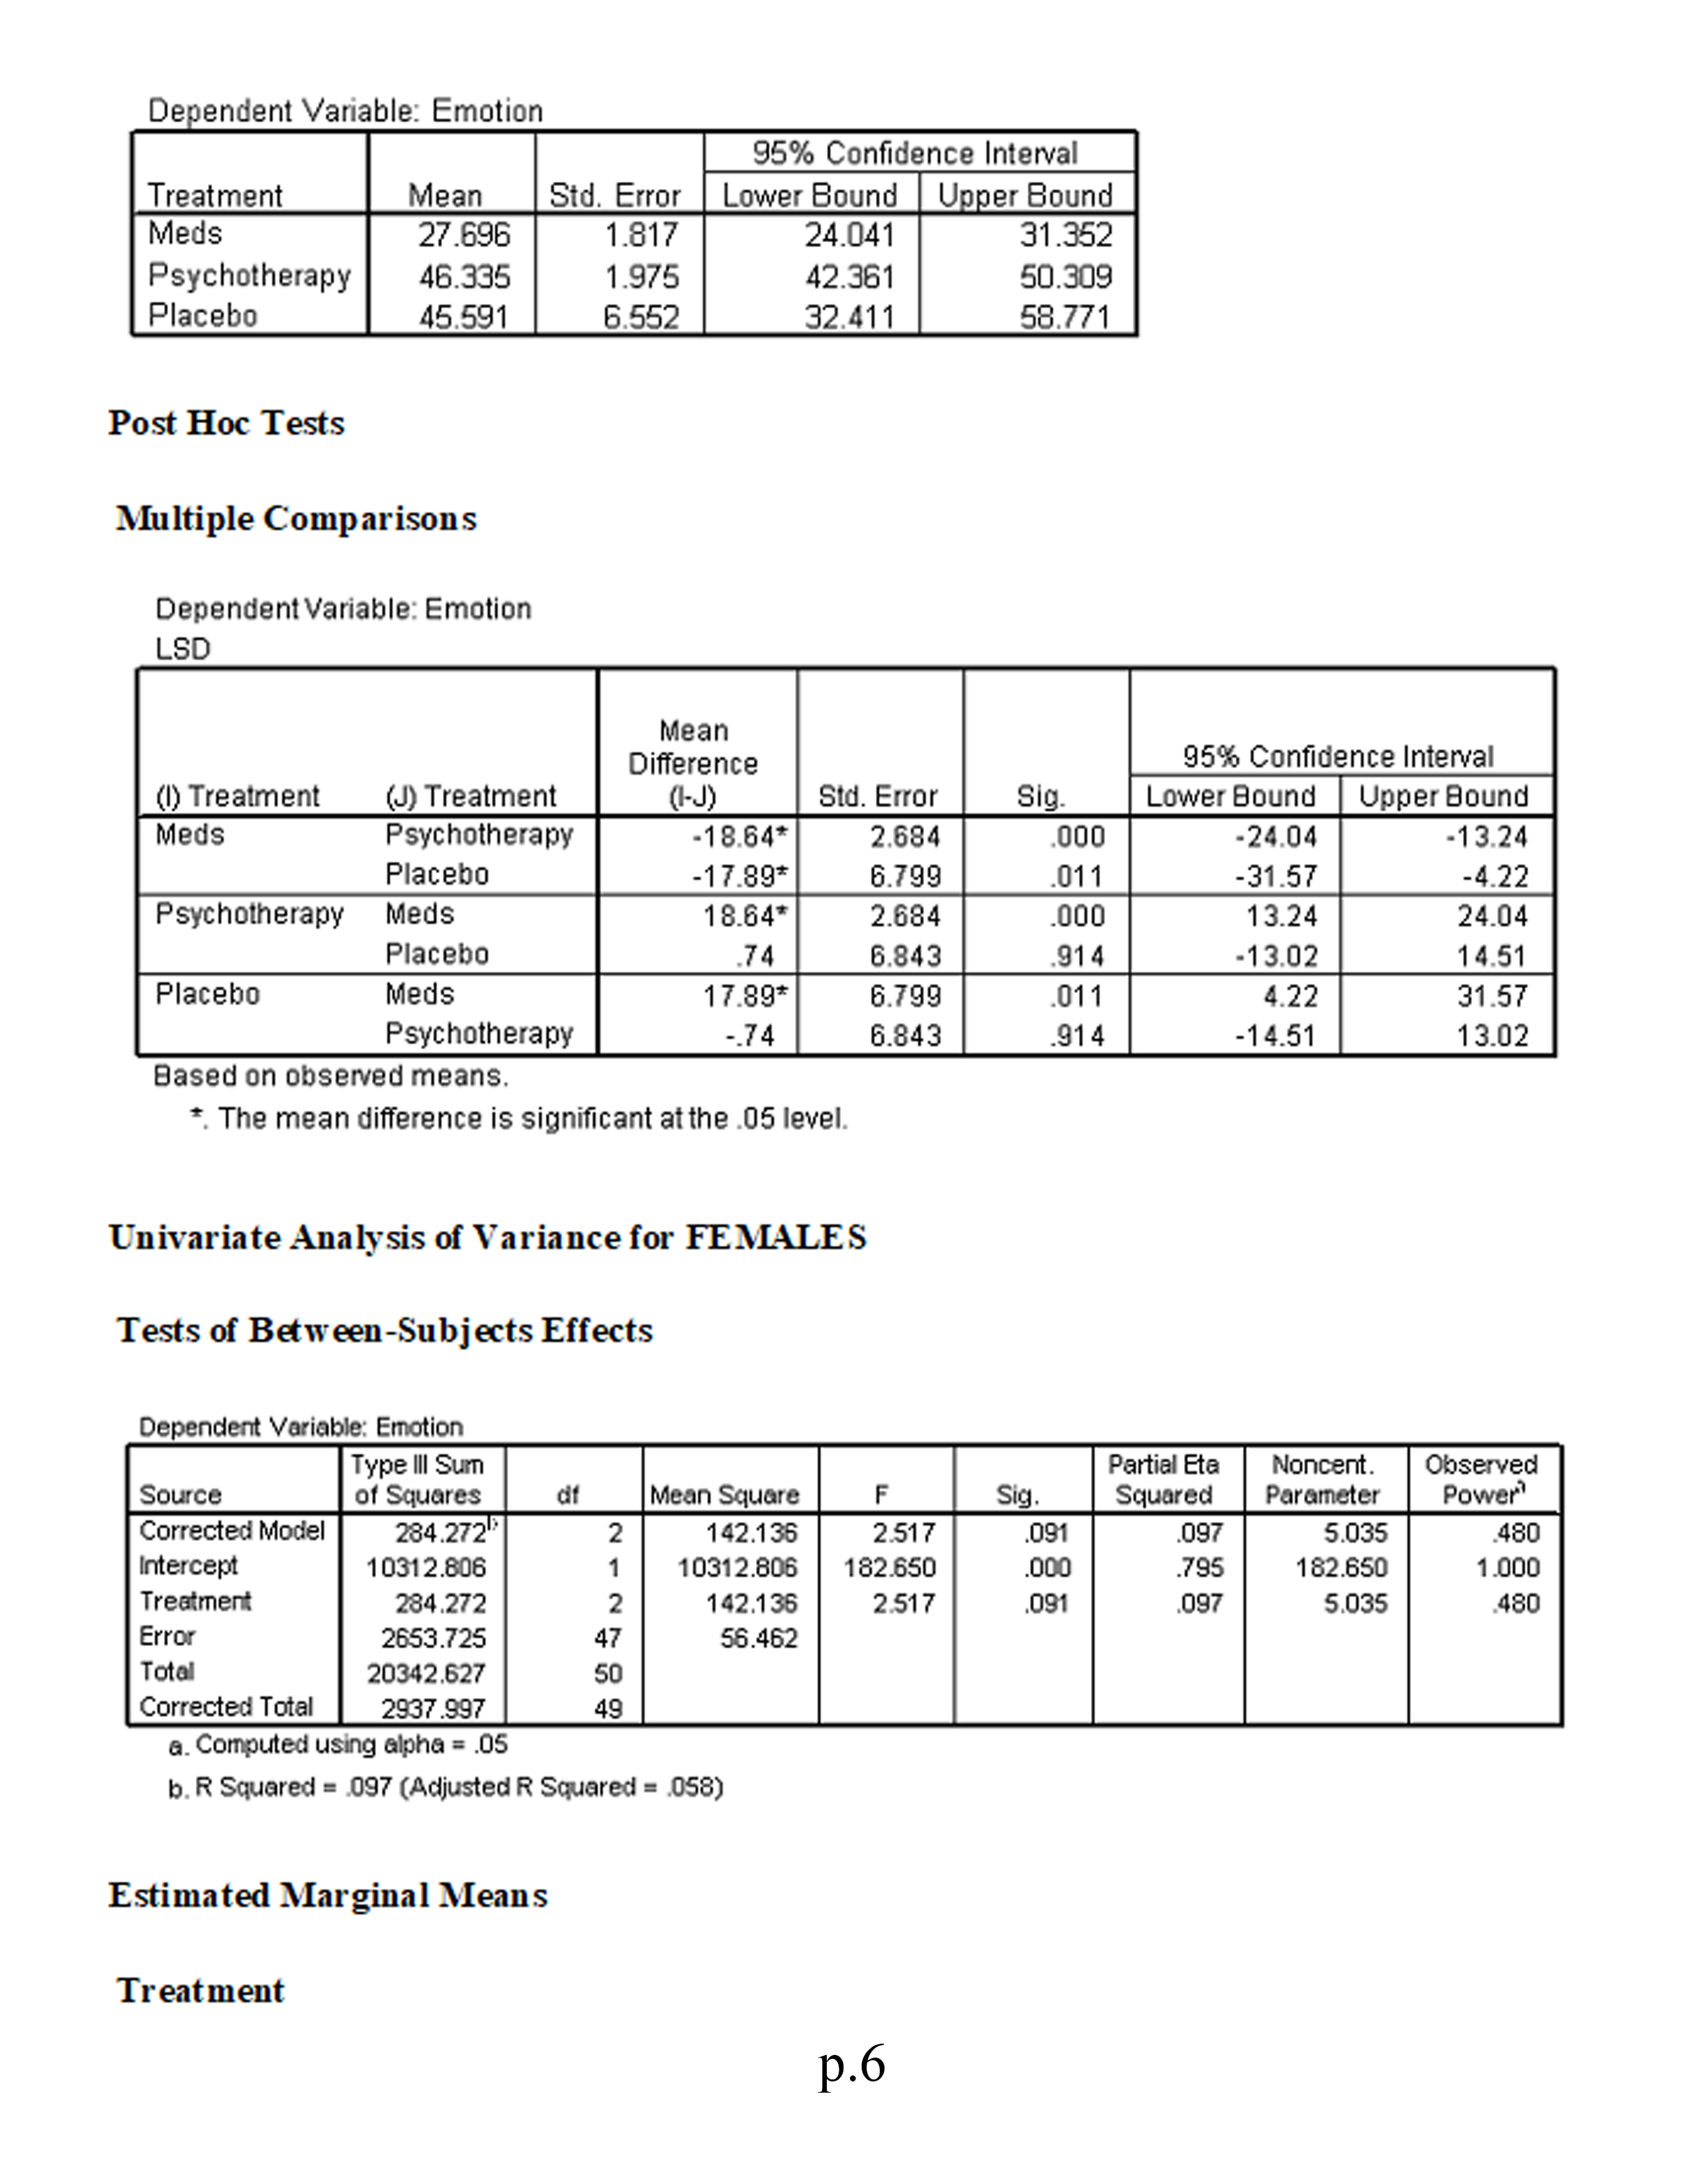
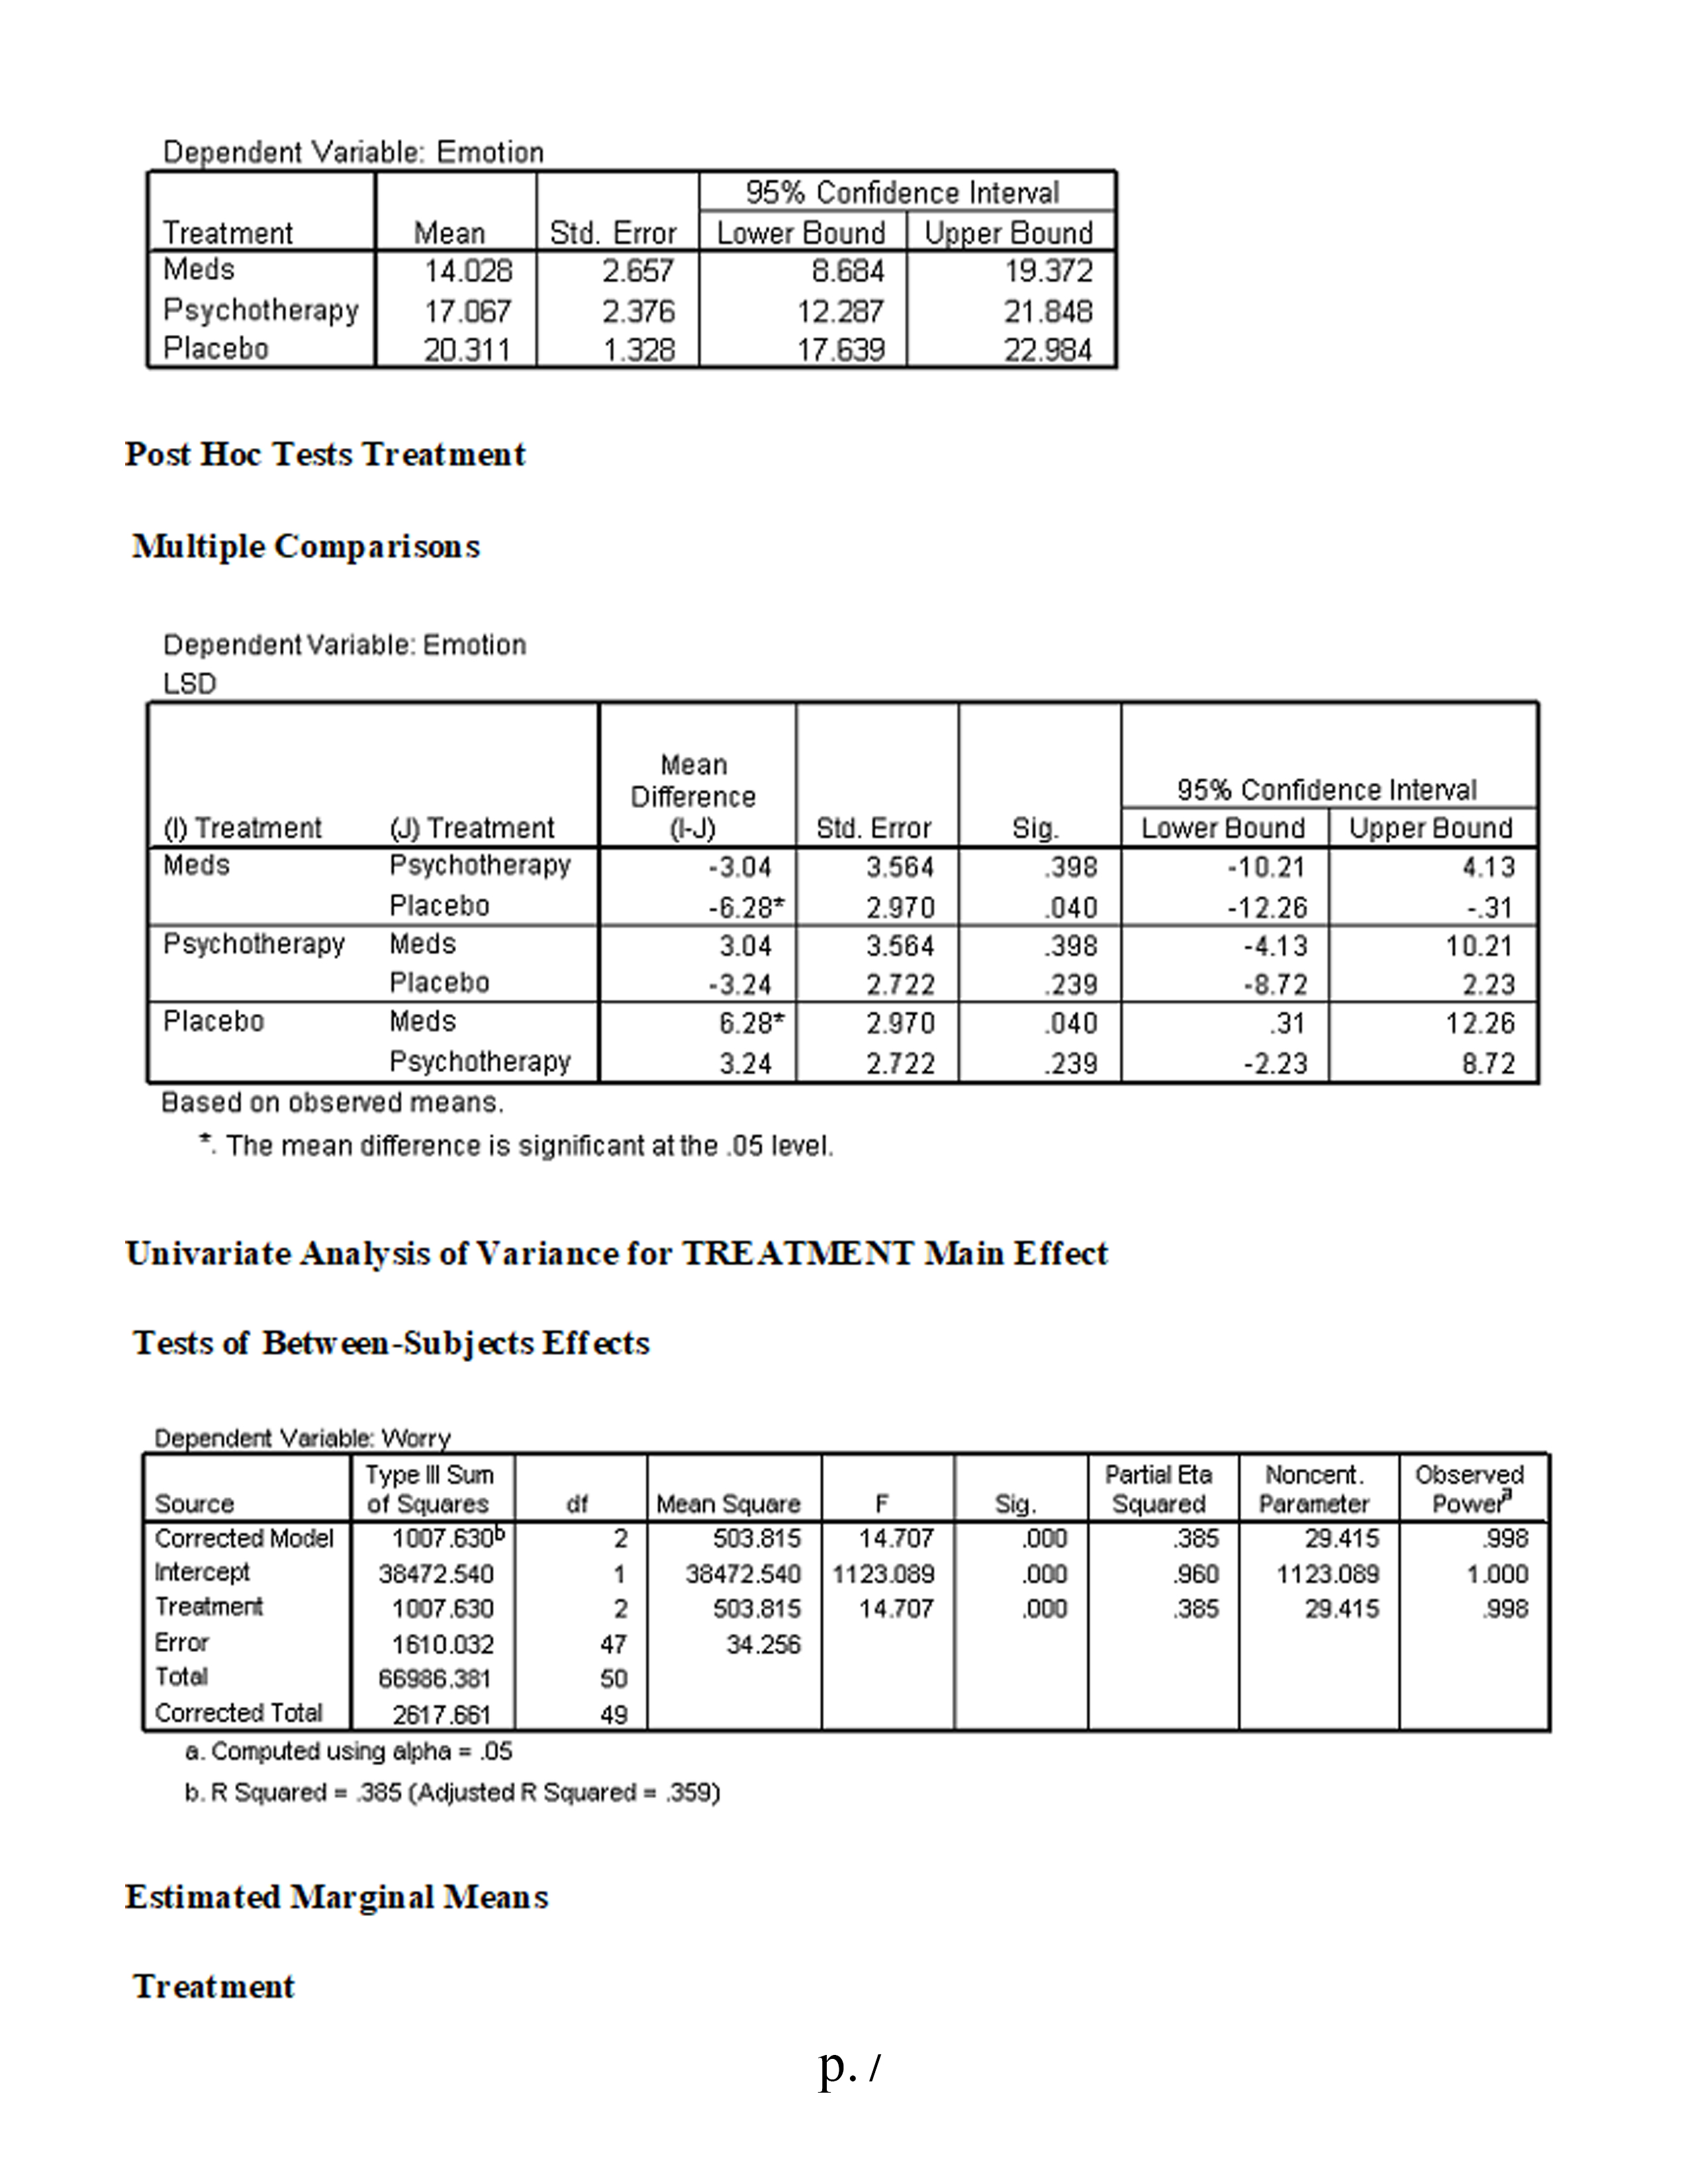
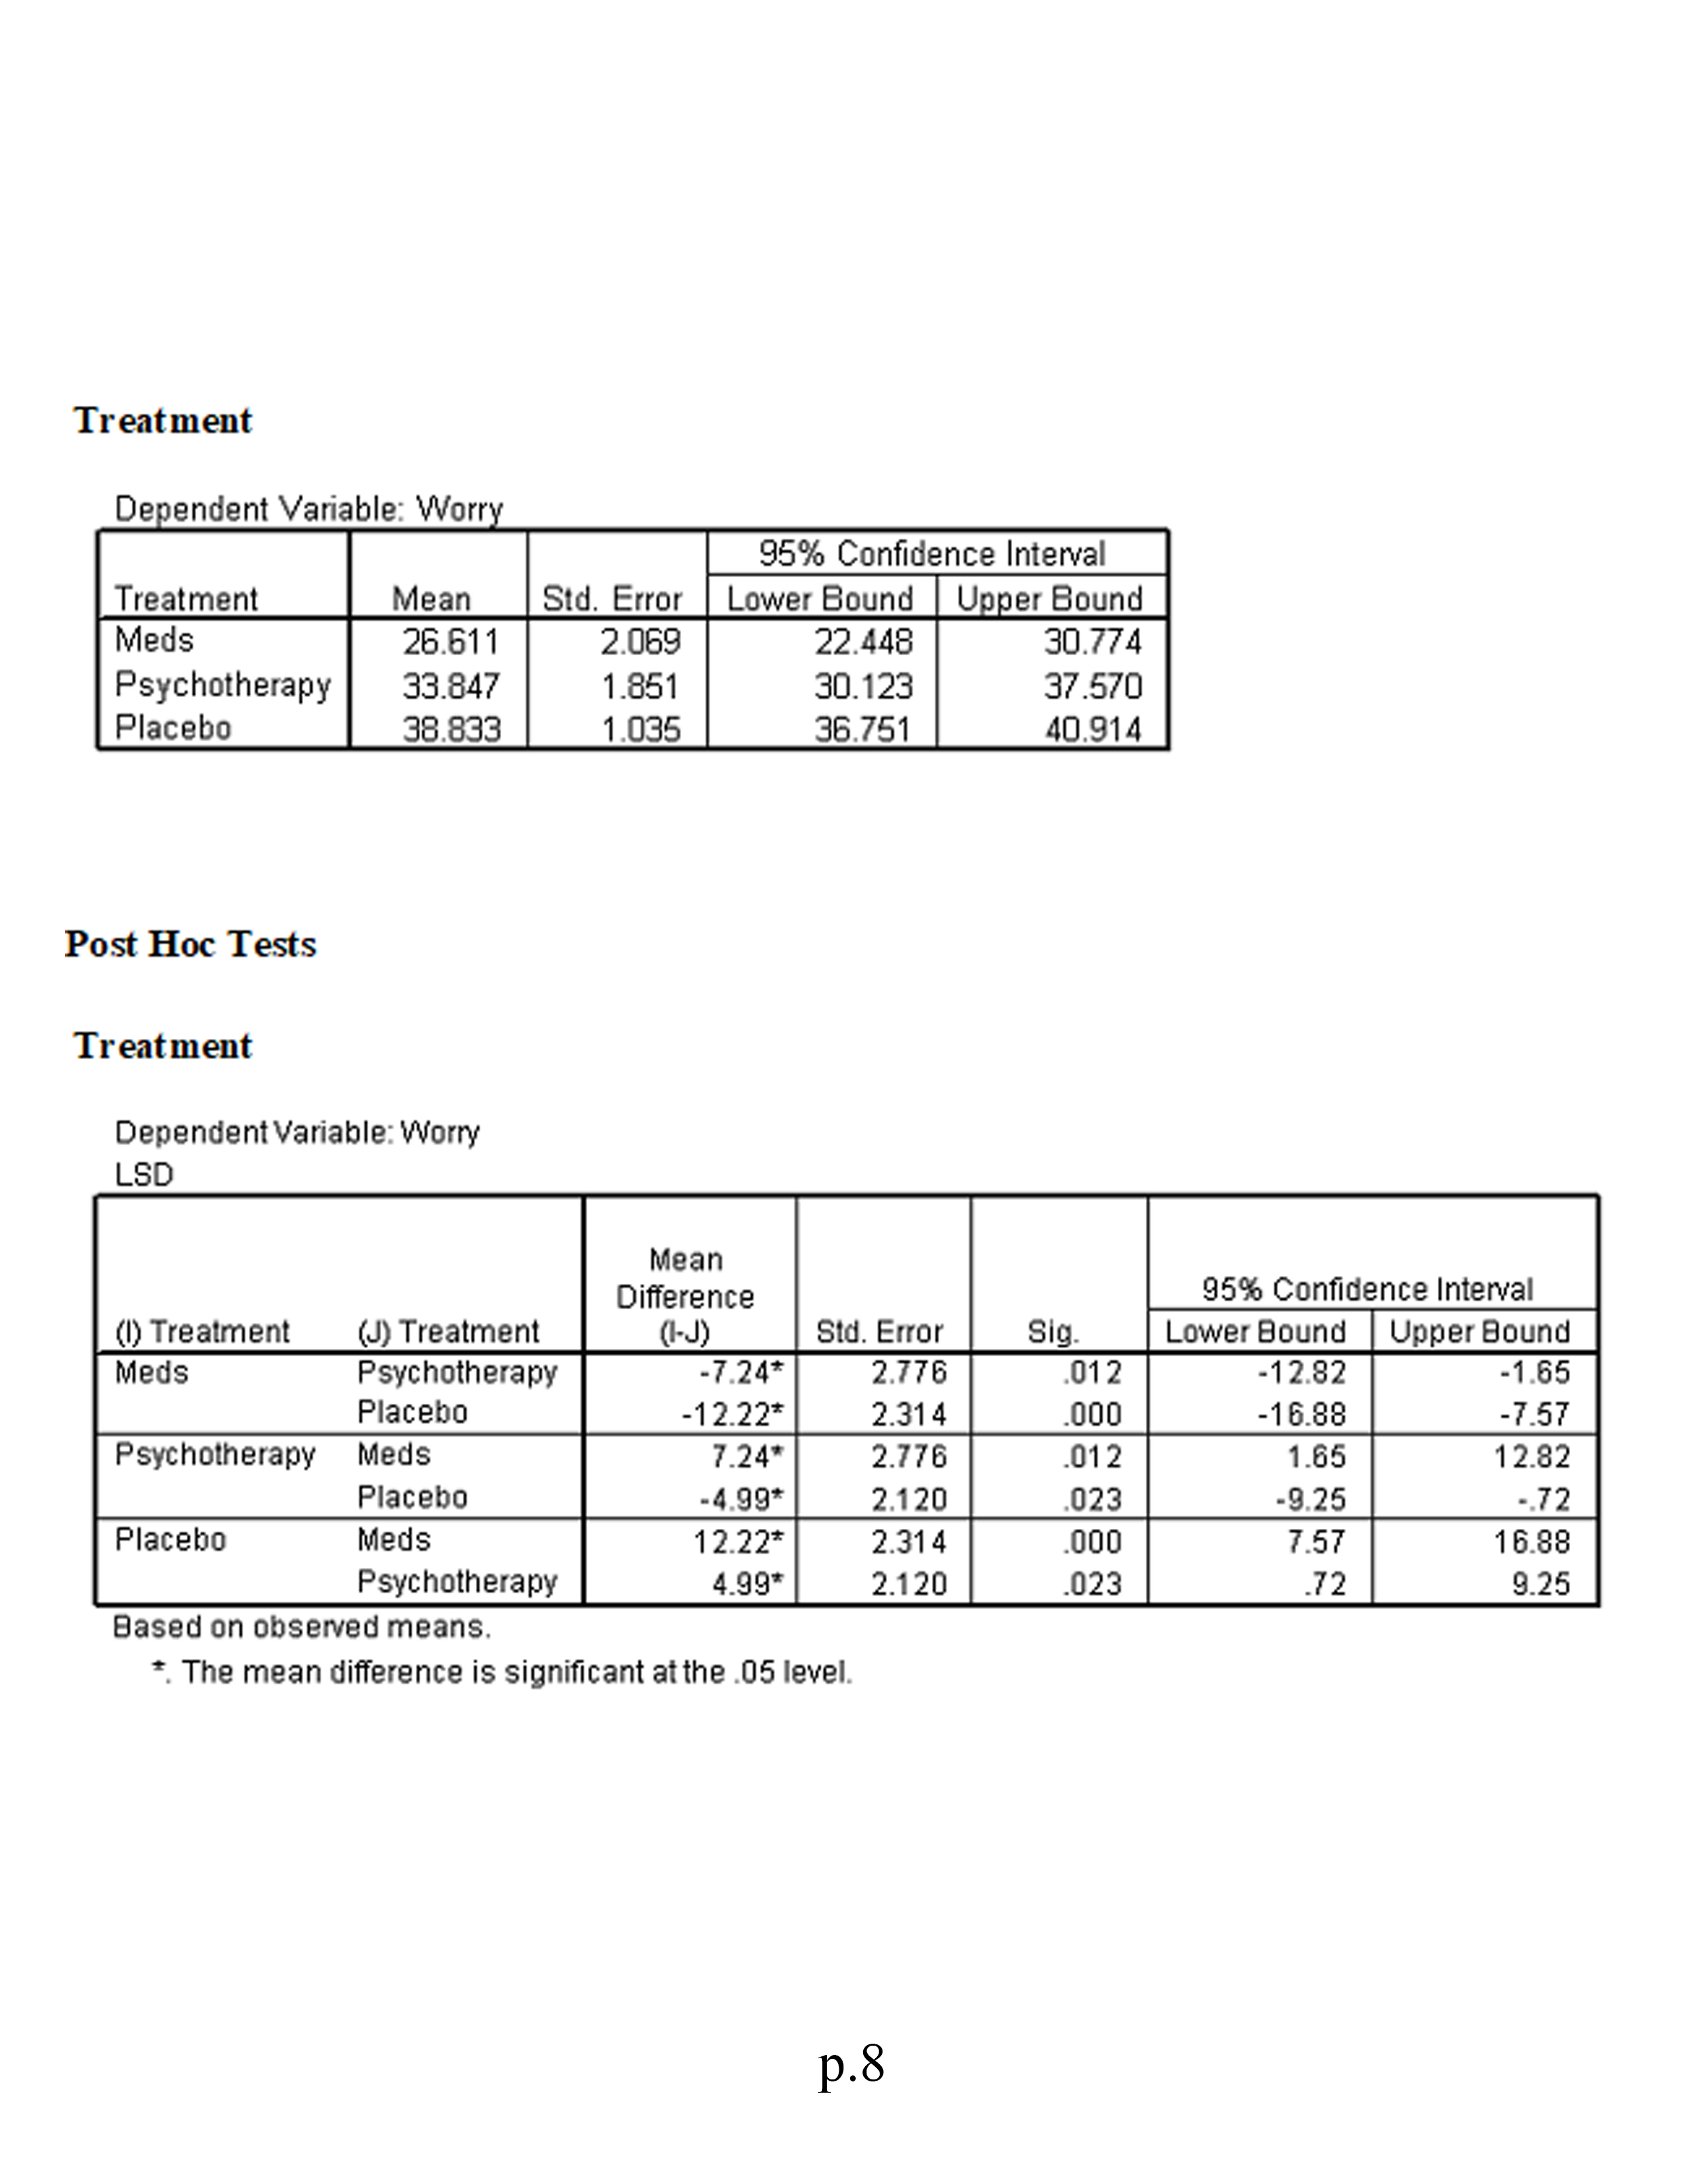
5.Identify the proper post hoc analyses for any statistically significant univariate effects. Explain your answer.
6.Is there a statistically significant multivariate gender effect on the dependent variate?
7.Why would a researcher conduct a MANOVA instead of several ANOVAs?
8.Write a results section for this research.
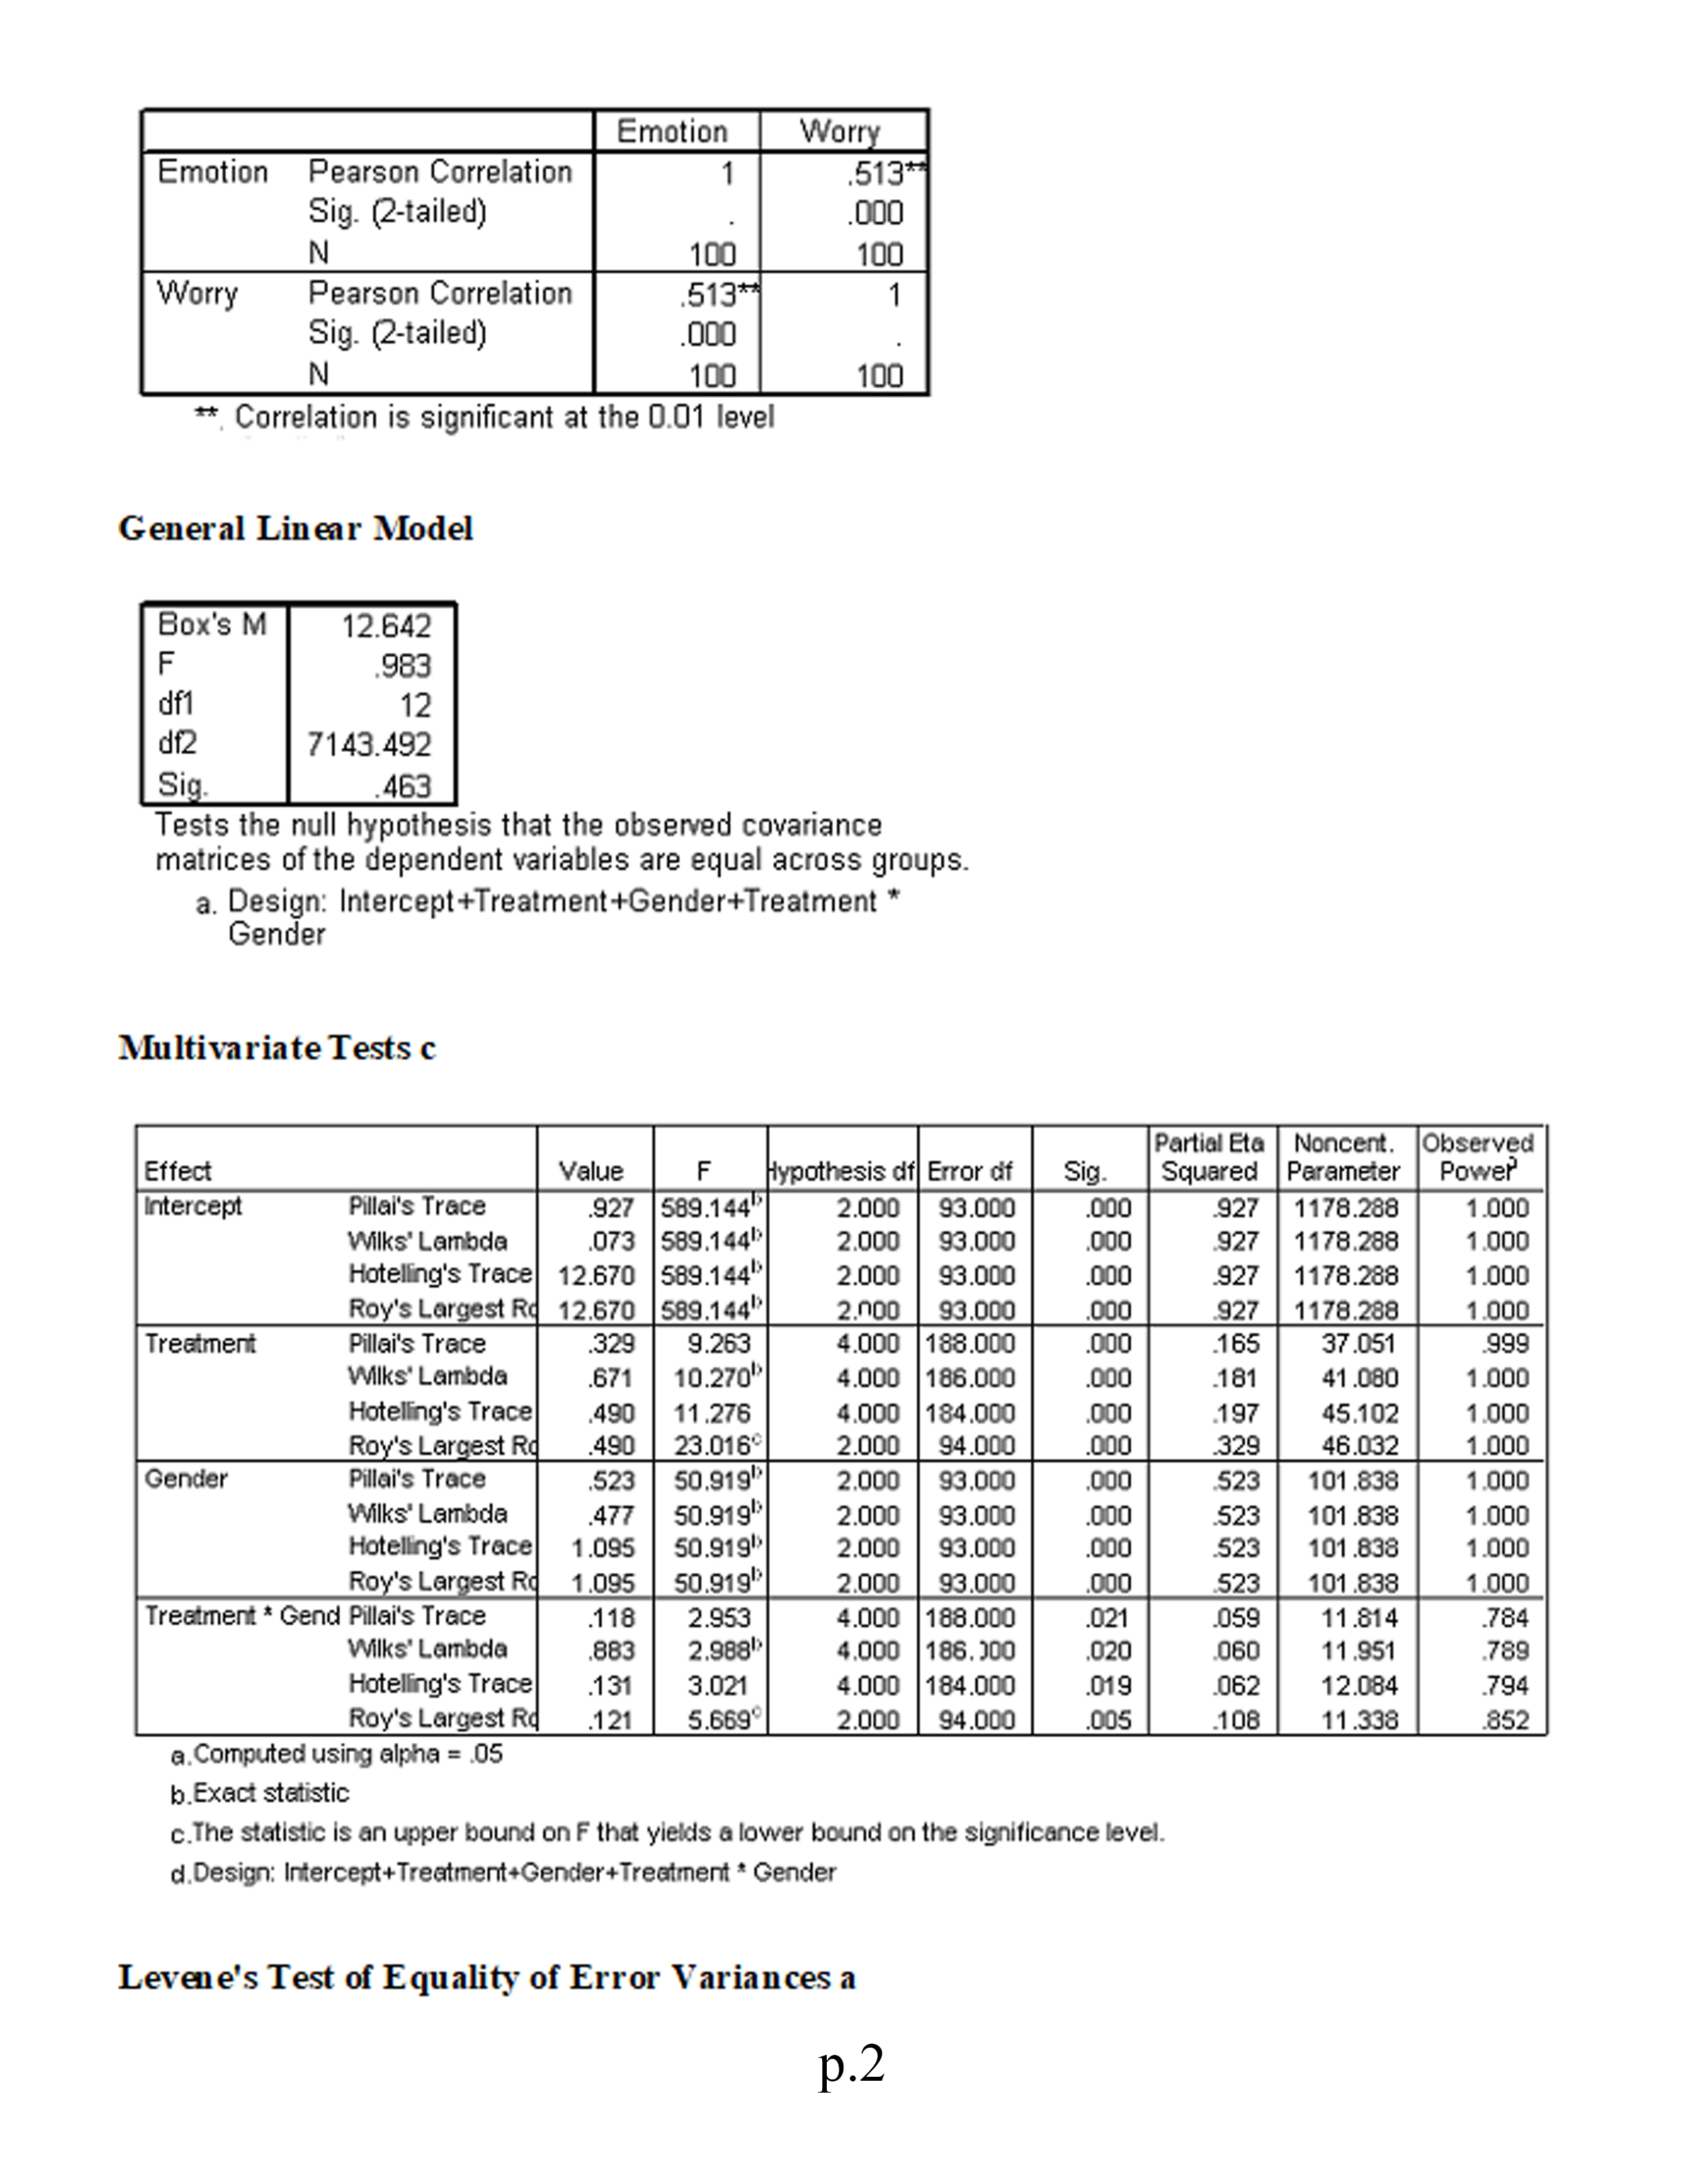
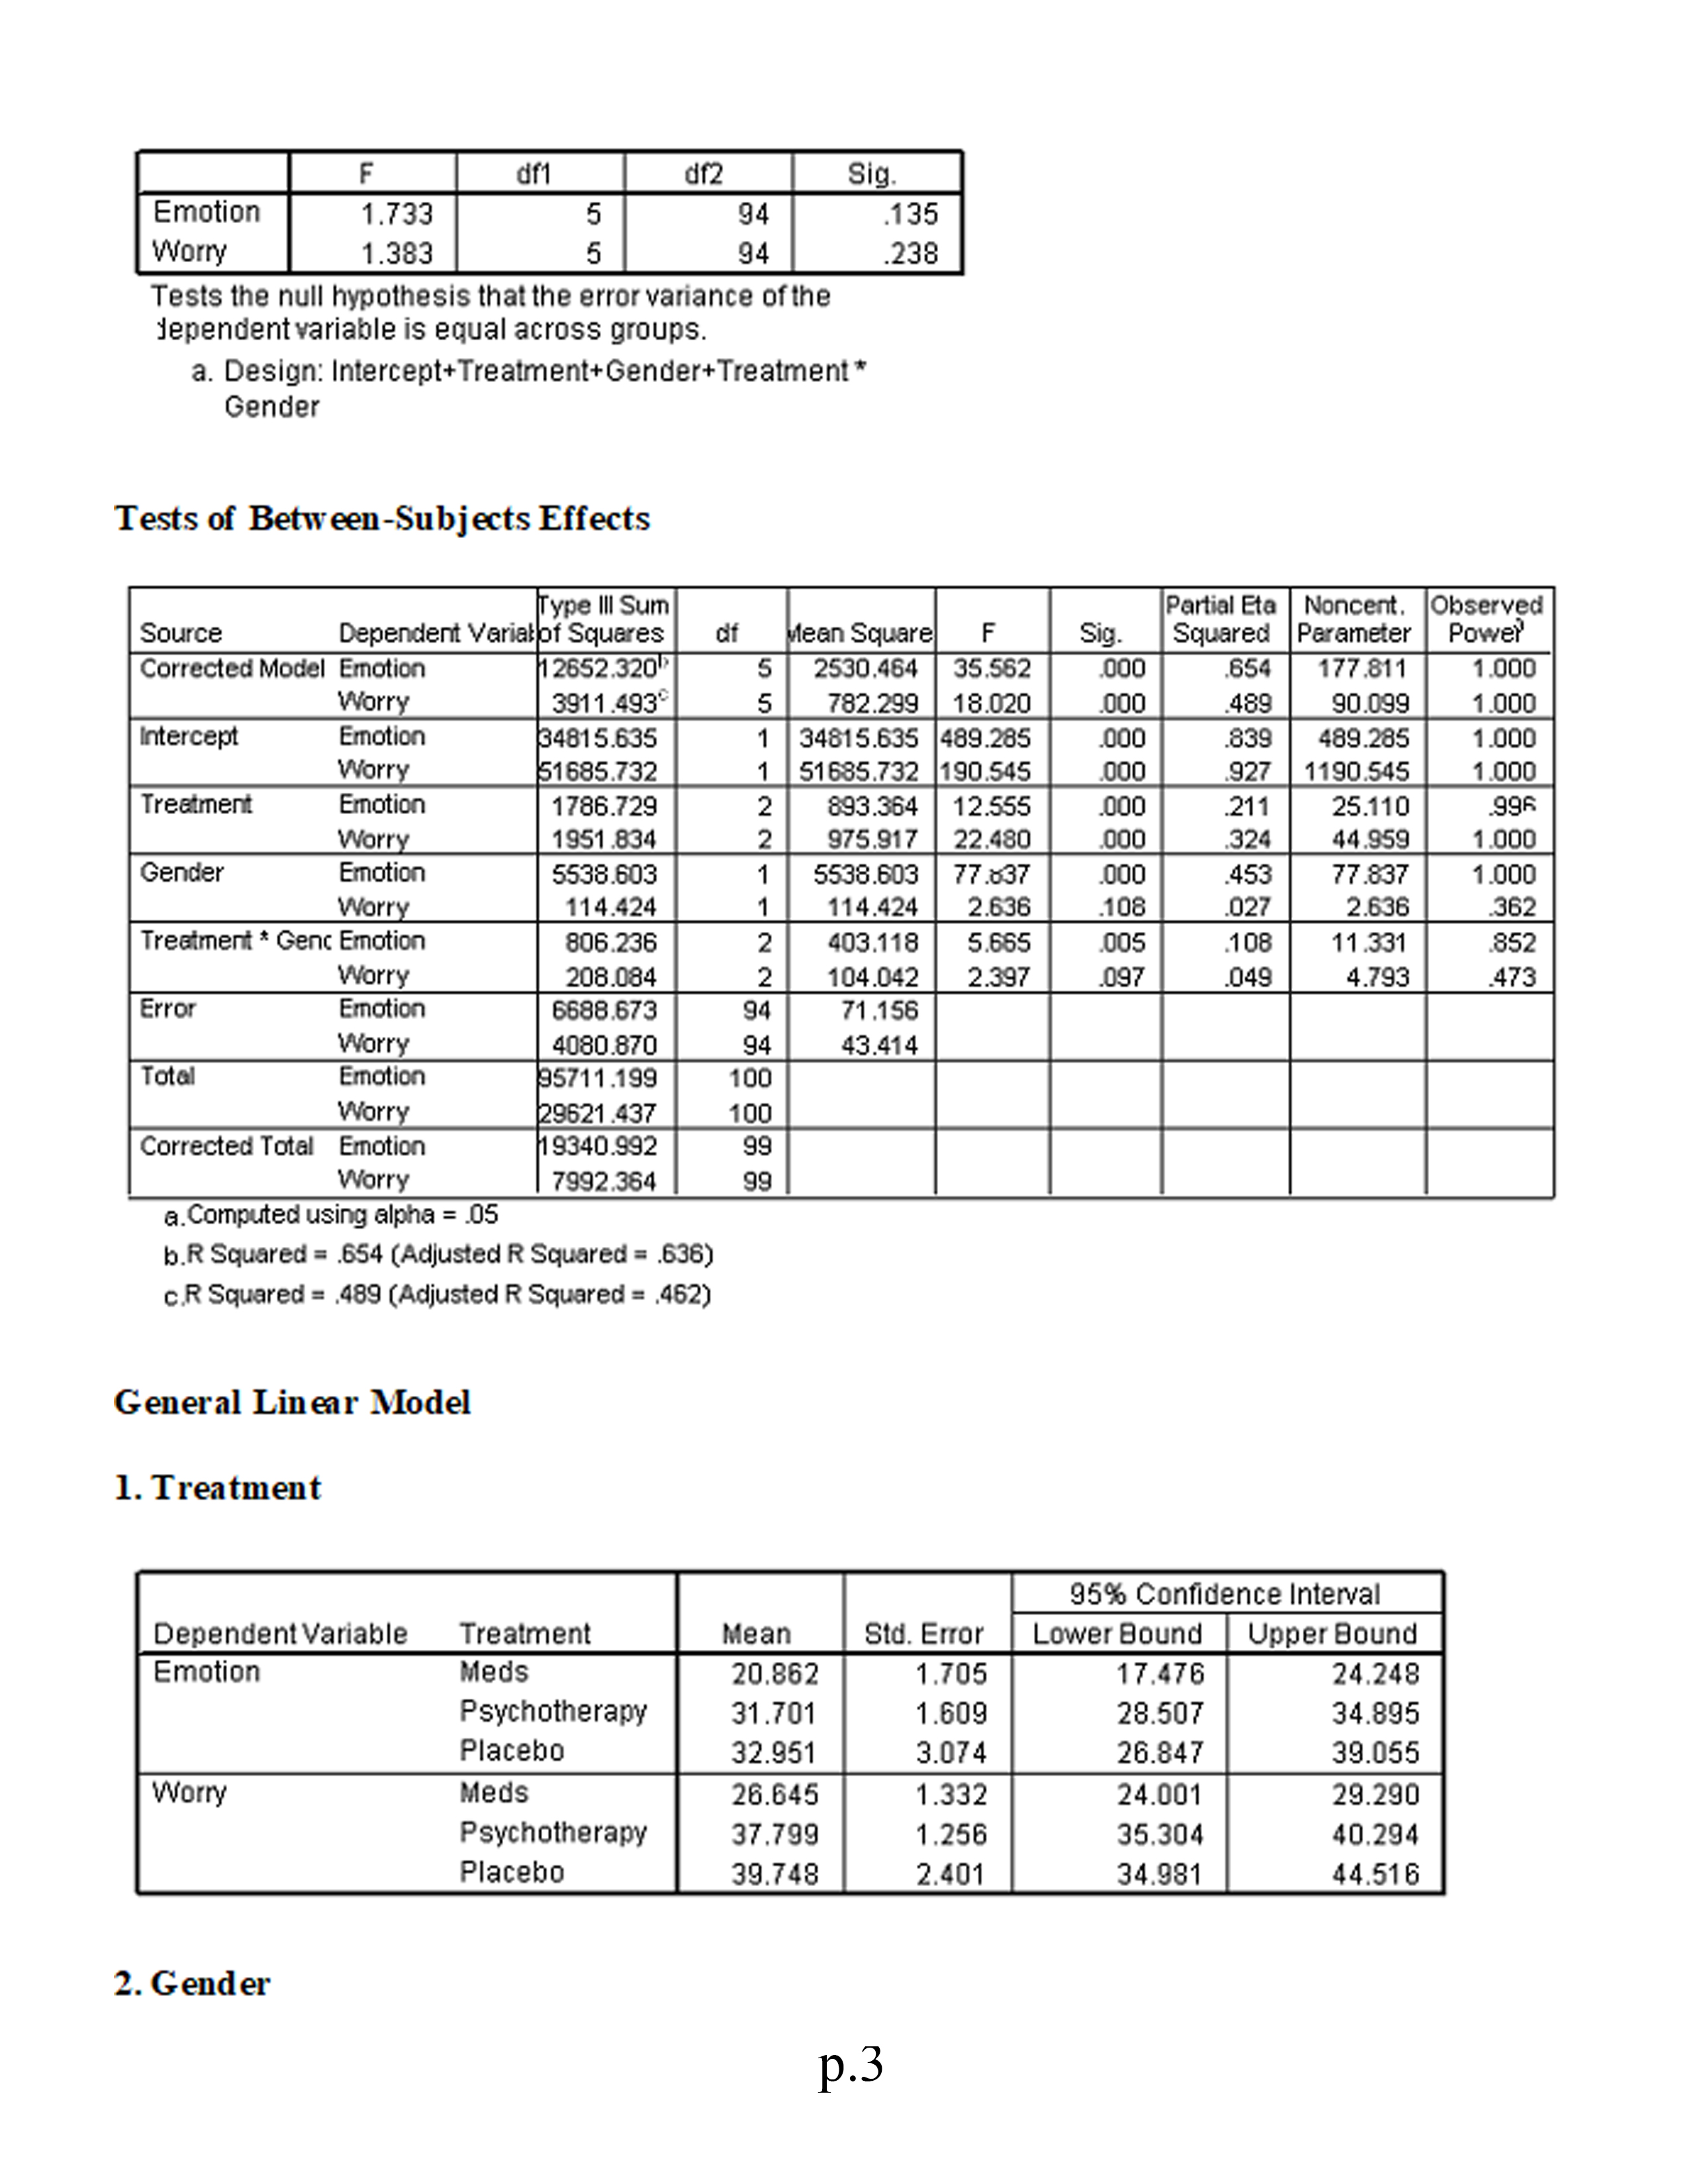
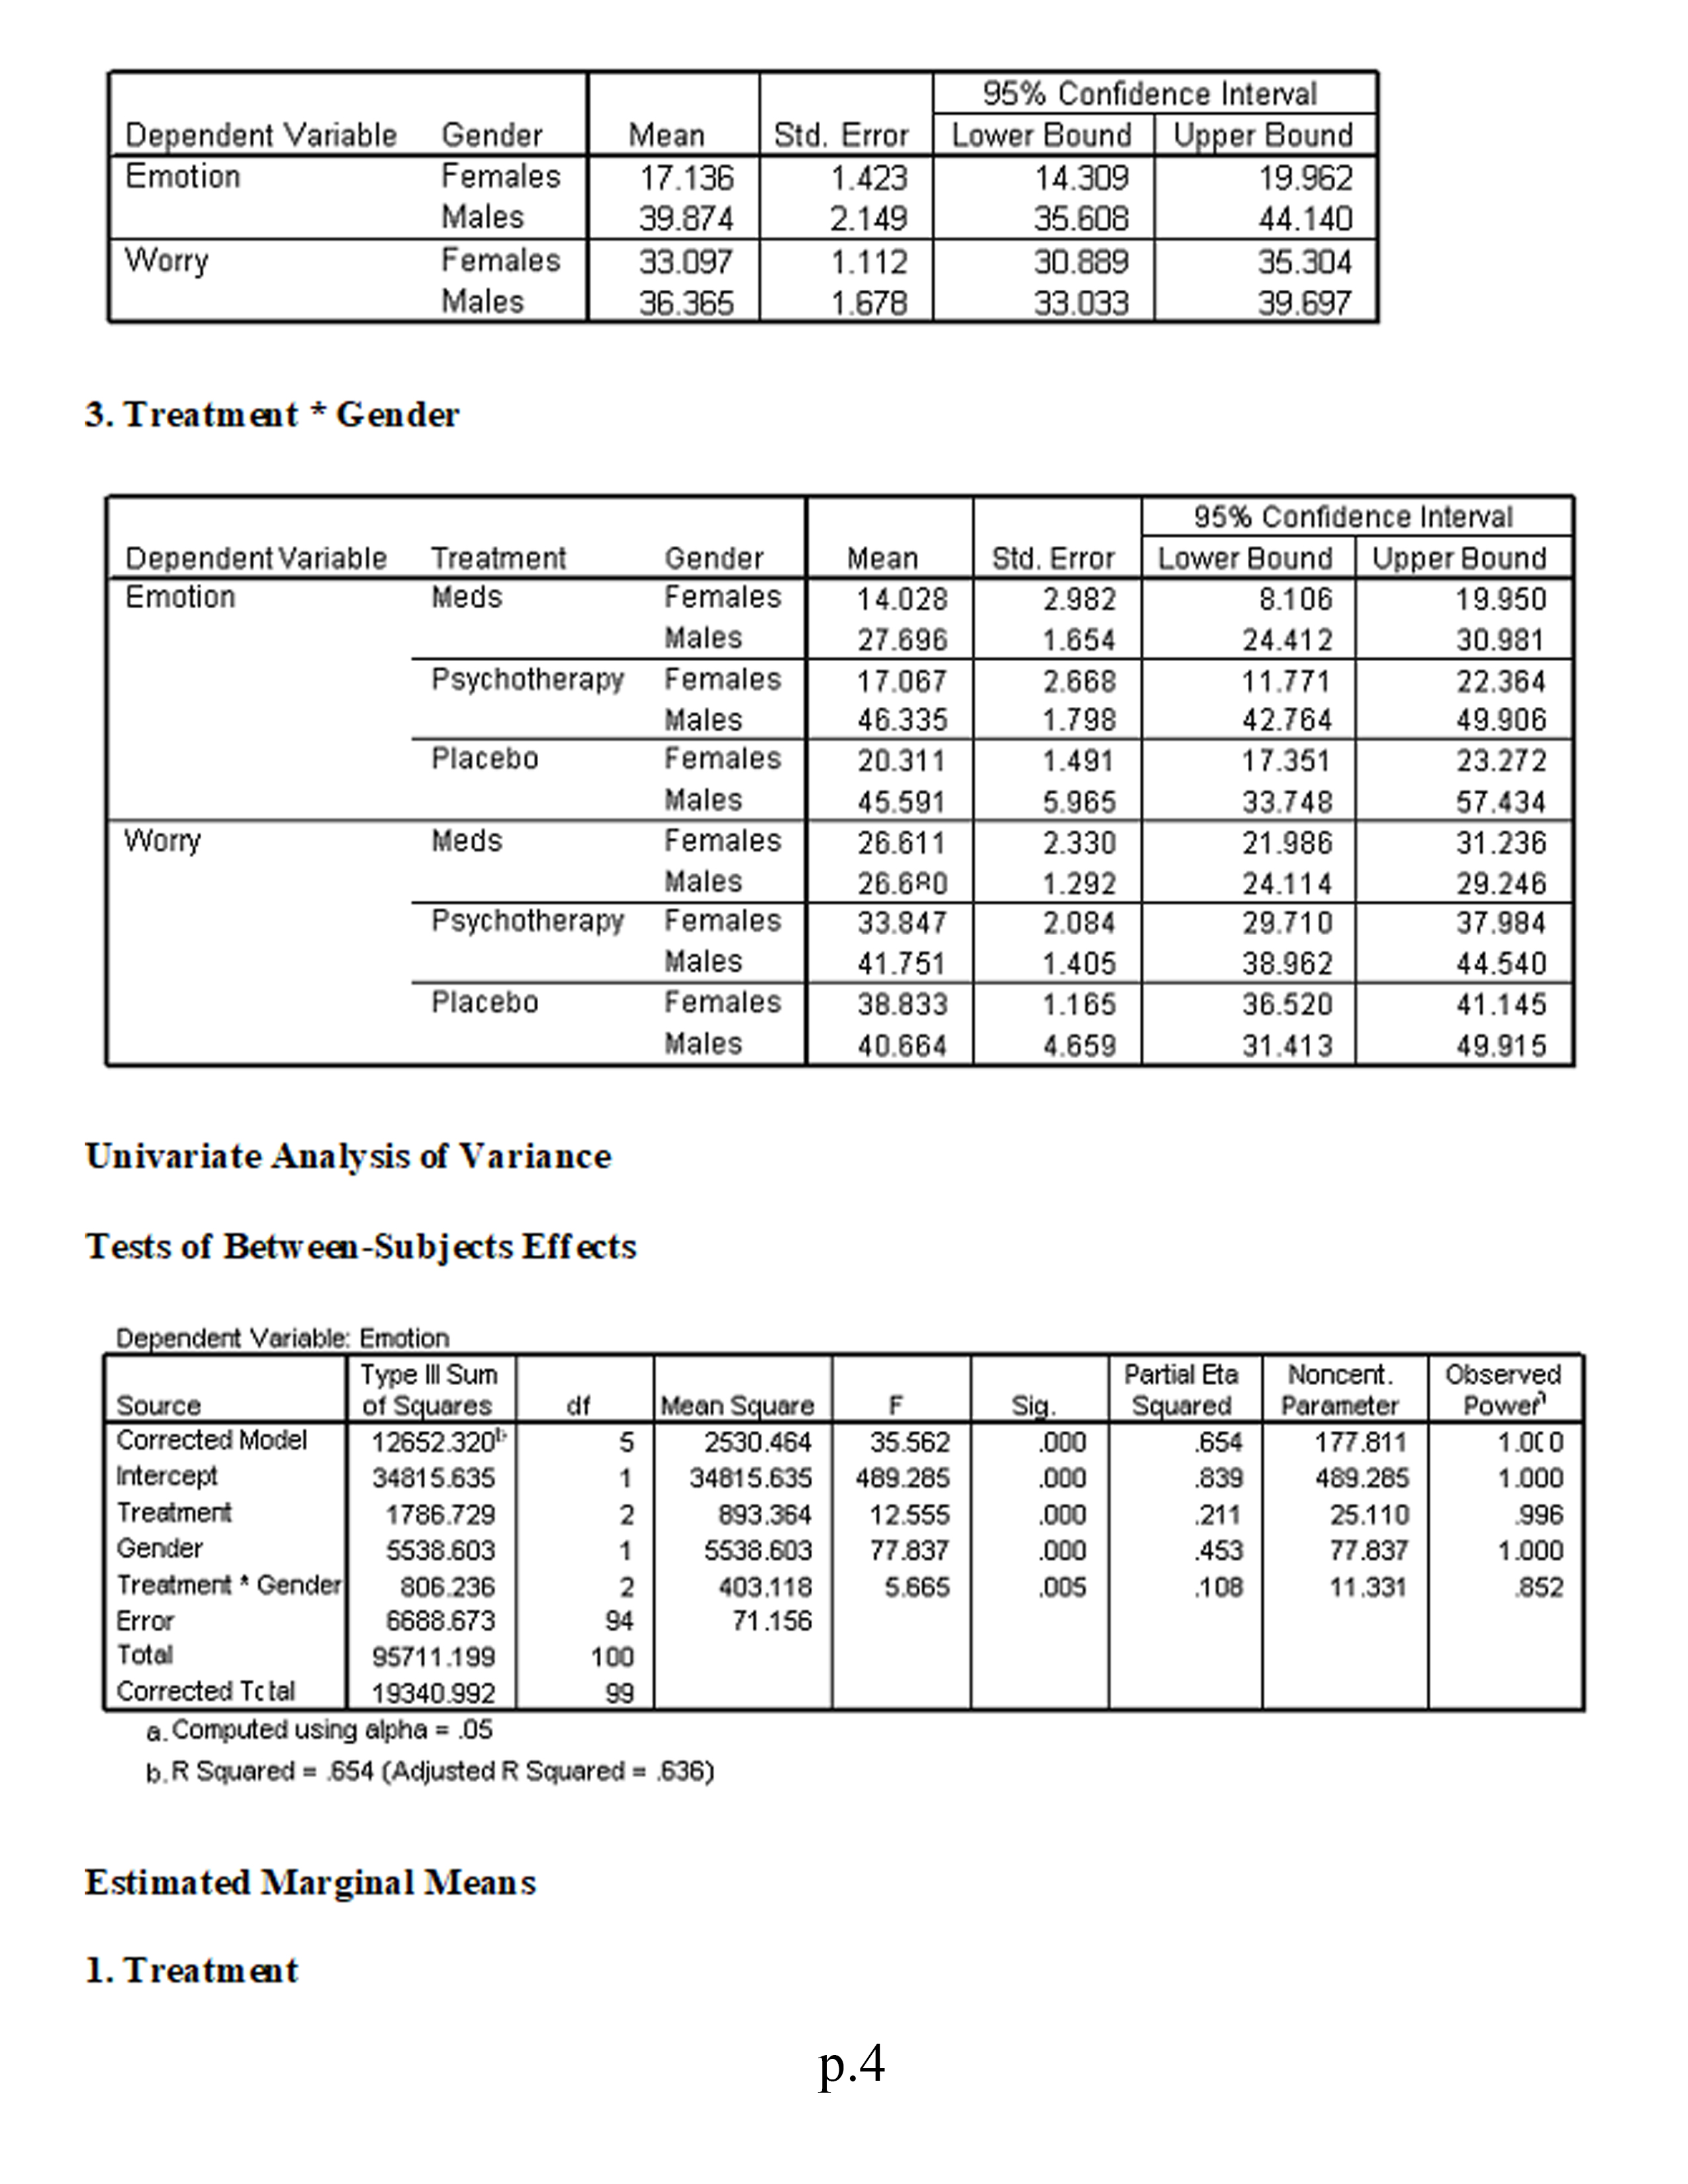
Factorial (2 x 3) MANOVA This study investigates the symptomatic improvement (measured by indexes of both worry and general emotion) of three different anxiety treatments for females and males. We are therefore interested not only in gender differences and treatment differences but also in whether or not gender moderates the effectiveness of the treatments (i.e., whether gender significantly interacts with treatment). To address these issues we use a factorial MANOVA design. Variables in study: . Treatment: 1 = medication; 2 = psychotherapy; 3 = placebo . Sex: 1 = male; 0 = female . Worry scale Emotion scale Using the SPSS data file for Module 8 (located in Topic Materials), answer the following questions: 1. Is there a sufficient correlation between the dependent variables to justify the use of MANOVA? 2. Was the assumption of equality of covariance matrices violated? Explain. 3. Is there a statistically significant multivariate interaction effect? Identify the dependent variable(s) of this interaction effect. 4. What would be the proper follow-up tests for a statistically significant interaction effect? 5. Identify the proper post hoc analyses for any statistically significant uni variate effects. Explain your answer. 6. Is there a statistically significant multivariate gender effect on the dependent variate? 7. Why would a researcher conduct a MANOVA instead of several ANOVAs? 8. Write a results section for this research. Correlations p. 1Emotion Worry Emotion Pearson Correlation 513* Sig. (2-tailed) 000 N 100 100 Worry Pearson Correlation 513+ Sig. (2-tailed) 000 N 100 100 * Correlation is significant at the 0.01 level General Linear Model Box's M 12.642 F 983 df1 12 df2 7143.492 Sig. 463 Tests the null hypothesis that the observed covariance matrices of the dependent variables are equal across groups. a. Design: Intercept+Treatment+Gender+Treatment * Gender Multivariate Tests c Partial Eta | Noncent. Observed Effect Value F Hypothesis df Error of Sig Squared Parameter Power Intercept Pillai's Trace 927 589.144 2.000 93.000 000 927 1178.288 1.000 Wilks' Lambda 073 589.144 2.000 93.000 000 927 1178.288 1.000 Hotelling's Trace 12.670 589.144 2.000 93.000 000 927 1178.288 1.000 Roy's Largest Ro 12.670 589.144 2.000 93.000 000 927 1178.288 1.000 Treatment Pillai's Trace .329 9.263 4.000 188.000 .000 .165 37.051 .999 Wilks' Lambde .671 10.270" 4.000 186.000 .000 .181 41.080 1.000 Hoteling's Trace 490 11.276 4.000 184.000 .000 197 45.102 1.000 Roy's Largest R 490 23.016 2.000 94.000 .000 .329 46.032 1.000 Gender Pillai's Trace 523 50.919 2.000 93.000 000 523 101.838 .00 Wilks' Lambde 477 50.919" 2.000 93.000 .000 523 101.838 1.000 Hoteling's Trace 1.095 50.919" 2.000 93.000 .000 .523 101.838 1.000 Roy's Largest Ro 1.095 50.919 2.000 93.000 000 523 101.838 1.000 Treatment * Gend Pillai's Trace .118 2.953 4.000 188.000 .021 .059 11.814 .784 Wilks' Lambda 883 2.988 4.000 186. 100 020 .060 11.951 .789 Hoteling's Trace .131 3.021 4.000 184.000 .019 .062 12.084 794 Roy's Largest Ro .121 5.669 2.000 94.000 .005 108 11.338 852 a. Computed using alpha = .05 b. Exact statistic c. The statistic is an upper bound on F that yields a lower bound on the significance level. d. Design: Intercept+Treatment+Gender+Treatment * Gender Levene's Test of Equality of Error Variances a p.2F diff df2 Big. Emotion 1.733 94 135 Worry 1.383 94 .238 Tests the null hypothesis that the error variance of the dependent variable is equal across groups. a. Design: Intercept+Treatment+Gender+Treatment* Gender Tests of Between-Subjects Effects Type Ill Sum Partial Eta | Noncent. Observed Source Dependent Variatof Squares Mean Square F Sig Squared Parameter Power Corrected Model Emotion 2652.320 2530.464 35.562 .000 654 177.811 1.000 Worry 3911.493" 782.299 18.020 000 489 90.099 1.000 Intercept Emotion 34815.635 34815.635 489.285 .000 839 489.285 1.000 Worry 51685.732 51685.732 190.545 000 927 1190.545 1.000 Treatment Emotion 1786.729 893.364 12.555 000 .211 25.110 .996 Worry 1951.834 NN 975.917 22.480 000 324 44.959 1.000 Gender Emotion 5538.603 6538.603 77.837 000 453 77.837 1.000 Worry 114.424 114.424 2.636 108 027 2.636 362 Treatment * Genc Emotion 806.236 403.118 5.665 005 852 Worry NN 108 11.331 208.084 104.042 2.397 .097 .049 4.793 473 Error Emotion 6688.673 94 71.156 Worry 4080.870 94 43.414 Total Emotion 95711.199 100 Worry 29621 .437 100 Corrected Total Emotion 19340.992 99 Worry 7992.364 99 a. Computed using alpha = .05 b.R Squared = .654 (Adjusted R Squared = .636) c.R Squared = .489 (Adjusted R Squared = .462) General Linear Model 1. Treatment 35% Confidence Interval Dependent Variable Treatment Mean Std. Error Lower Bound Upper Bound Emotion Meds 20.862 1.705 17.476 24.248 Psychotherapy 31.701 1.609 28.507 34.895 Placebo 32.951 3.074 26.847 39.055 Worry Meds 26.645 1.332 24.001 29.290 Psychotherapy 37.799 1.256 35.304 40.294 Placebo 39.748 2.401 34.981 44.516 2. Gender p.395% Confidence Interval Dependent Variable Gender Mean Std. Error Lower Bound Upper Bound Emotion Females 17.136 1.423 14.309 19.962 Males 39.874 2.149 35.608 44.140 Worry Females 33.097 1.112 30.889 35.304 Males 36.365 1.678 33.033 39.697 3. Treatment * Gender 95% Confidence Interval Dependent Variable Treatment Gender Mean Std. Error Lower Bound Upper Bound Emotion Meds Females 14.028 2.982 8.106 19.950 Males 27.696 1.654 24.412 30.981 Psychotherapy Females 17.067 2.668 1 1.771 22.364 Males 46.335 1.798 42.764 49.906 Placebo Females 20.311 1.491 17.351 23.272 Males 45.591 5.965 33.748 57.434 Worry Meds Females 26.611 2.330 21.986 31.236 Males 26.680 1.292 24.114 29.246 Psychotherapy Females 83.847 2.084 29.710 37.984 Males 41.751 1.405 38.962 44.540 Placebo Females 38.833 1.165 36.520 41.145 Males 40.664 4.659 31.413 49.915 Univariate Analysis of Variance Tests of Between-Subjects Effects Dependent Variable: Emotion Type Ill Sum Partial Ete Noncent. Observed Source of Squares Mean Square Sig. Squared Parameter Power Corrected Model 12652.320 2530.464 35.562 .000 .654 177.811 1.00 0 Intercept 34815.635 34815.635 489.285 .000 839 489.285 1.000 Treatment 1786.729 893.364 12.555 .000 211 25.110 .996 Gender 5538.603 5538.603 77.837 .000 453 77.837 1.000 Treatment * Gender 806.236 403.118 5.665 .005 108 11.331 .852 Error 6688.673 94 71.156 Total 95711.199 100 Corrected Total 19340.992 99 a. Computed using alpha = .05 b. R Squared = .654 (Adjusted R Squared = .636) Estimated Marginal Means 1. Treatment p.4Dependent Variable: Emotion 95% Confidence Interval Treatment Mean Std. Error Lower Bound Upper Bound Meds 20.862 1.705 7.476 24.248 Psychotherapy 31.701 1.609 28.507 34.895 Placebo 32.951 3.074 26.847 39.055 2. Gender Dependent Variable: Emotion 95% Confidence Interval Gender Mean Std. Error Lower Bound Upper Bound Females 17.136 .423 4.309 9.962 Males 39.874 2.149 35.608 44.140 3. Treatment * Gender Dependent Variable: Emotion 95% Confidence Interval Treatment Gender Mean Std. Error Lower Bound Upper Bound Meds Females 14.028 2.982 B.106 9.950 Males 27.696 1.654 24.412 30.981 Psychotherapy Females 17.067 2.668 11.771 22.364 Males 46.335 1.798 42.764 49.906 Placebo Females 20.311 1.491 17.351 23.272 Males 45.591 5.965 33.748 57.434 Univariate Analysis of Variance for MALES Tests of Between-Subjects Effects Dependent Variable: Emotion Type Ill Sum Partial Eta Noncent Observed Source of Squares df Mean Square Sig. Squared Parameter Power Corrected Model 4307.7430 IN-N 2153.871 25.089 .000 516 50.178 1.000 Intercept 24506.047 24506.047 285.452 000 .859 285.452 1.000 Treatment 4307 .743 2153.871 25.089 .000 516 50.178 1.000 Error 4034.948 47 85.850 Total 75368.572 50 Corrected Total 8342.691 19 a. Computed using alpha = .05 b.R Squared = 516 (Adjusted R Squared = .496) Estimated Marginal Means Treatment p.5Dependent Variable: Emotion 95% Confidence Interval Treatment Mean Std. Error Lower Bound Upper Bound Meds 27.696 1.817 24.041 31.352 Psychotherapy 46.335 1.975 42.361 50.309 Placebo 45.591 6.552 32.411 58.771 Post Hoc Tests Multiple Comparisons Dependent Variable: Emotion LSD Mean Difference 95% Confidence Interval () Treatment (J) Treatment (I-J) Std. Error Sig. Lower Bound Upper Bound Meds Psychotherapy -18.64* 2.684 000 24.04 13.24 Placebo -17.89* 6.799 01 1 31.57 4.27 Psychotherapy Meds 18.64* 2.684 000 13.24 24.04 Placebo 74 6.843 914 13.02 14.51 Placebo Meds 17.89* 6.799 011 4.22 31.57 Psychotherapy -.74 6.843 914 -14.51 13.02 Based on observed means. *. The mean difference is significant at the .05 level. Univariate Analysis of Variance for FEMALES Tests of Between-Subjects Effects Dependent Variable: Emotion Type Ill Sum Partial Et Noncent Observed Source of Squares Mean Square Sig Squared Parameter Power Corrected Mode 284.272 2.517 091 .097 Intercept 10312.806 N 142.136 5.035 480 10312.806 182.650 .795 182.650 1.000 Treatment 284.272 IN 142.136 2.517 091 097 5.035 480 Error 2653.725 47 56.462 Total 20342.627 50 Corrected Total 2937.997 19 a. Computed using alpha = .05 b. R Squared = 097 (Adjusted R Squared = .058) Estimated Marginal Means Treatment p.6Dependent Variable: Emotion 95% Confidence Interval Treatment Mean Std. Error Lower Bound | Upper Bound Meds 14.028 2.657 8.684 19.372 Psychotherapy 17.067 2.376 12.287 21.848 Placebo 20.311 1.328 17.639 22.984 Post Hoc Tests Treatment Multiple Comparisons Dependent Variable: Emotion LSD Mean Difference 95% Confidence Interval (1) Treatment (J) Treatment (I-J) Std. Error Sig. Lower Bound Upper Bound Meds Psychotherapy .3.04 3.564 398 10.21 4.13 Placebo .6.28* 2.970 040 12.26 -31 Psychotherapy Meds 3.04 3.564 398 -4.13 10.21 Placebo 3.24 2.722 239 -8.72 2.23 Placebo Meds 6.28 2.970 040 .31 12.26 Psychotherapy 3.24 2.722 239 -2.23 8.72 Based on observed means. *. The mean difference is significant at the .05 level. Univariate Analysis of Variance for TREATMENT Main Effect Tests of Between-Subjects Effects Dependent Variable: Worry Type Ill Sum Partial Eta Noncent. Observed Source of Squares Mean Square Sig. Squared Parameter Power Corrected Model 1007.630 2 503.815 .000 .385 29.415 .998 Intercept 38472.540 N - 14.707 38472.540 1123.089 000 .960 1123.089 1.000 Treatment 1007.630 503.815 14.707 .000 .385 29.415 .998 Error 1610.032 47 34.256 Total 66986.381 50 Corrected Total 2617.661 49 . Computed using alpha = .05 b. R Squared = 385 (Adjusted R Squared = .359) Estimated Marginal Means Treatment p. /Treatment Dependent Variable: Worry 95% Confidence Interval Treatment Mean Std. Error Lower Bound Upper Bound Meds 26.611 2.069 22.448 30.774 Psychotherapy 33.847 1.851 30.123 37.570 Placebo 38.833 1.035 36.751 40.914 Post Hoc Tests Treatment Dependent Variable: Worry LSD Mean Difference 95% Confidence Interval (1) Treatment (J) Treatment (1-J) Std. Error Sig Lower Bound |Upper Bound Meds Psychotherapy -7.24* 2.776 012 12.82 1.65 Placebo -12.22 2.314 000 -16.88 -7.57 Psychotherapy Meds 7.24* 2.776 012 1.65 12.82 Placebo .4.99* 2.120 023 -9.25 -.72 Placebo Meds 12.22* 2.314 000 7.57 16.88 Psychotherapy 4.99* 2.120 023 .72 9.25 Based on observed means. *. The mean difference is significant at the .05 level. p.8
