

Question: Hello, I need 5-8 completed as well as 17 and 18. Thank you! Putting Graphs in Context In Exercises 5-8, match the plot with the
Hello, I need 5-8 completed as well as 17 and 18. Thank you!
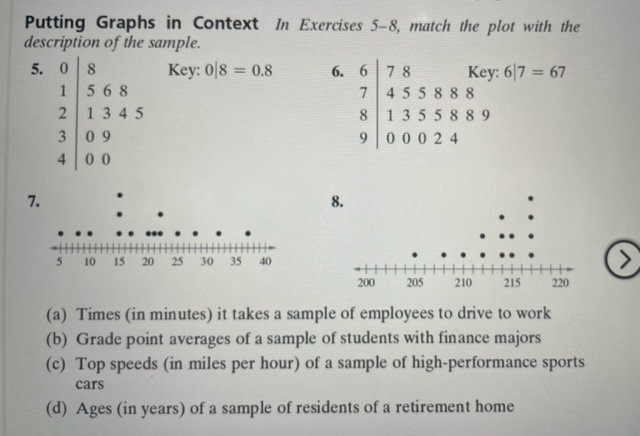
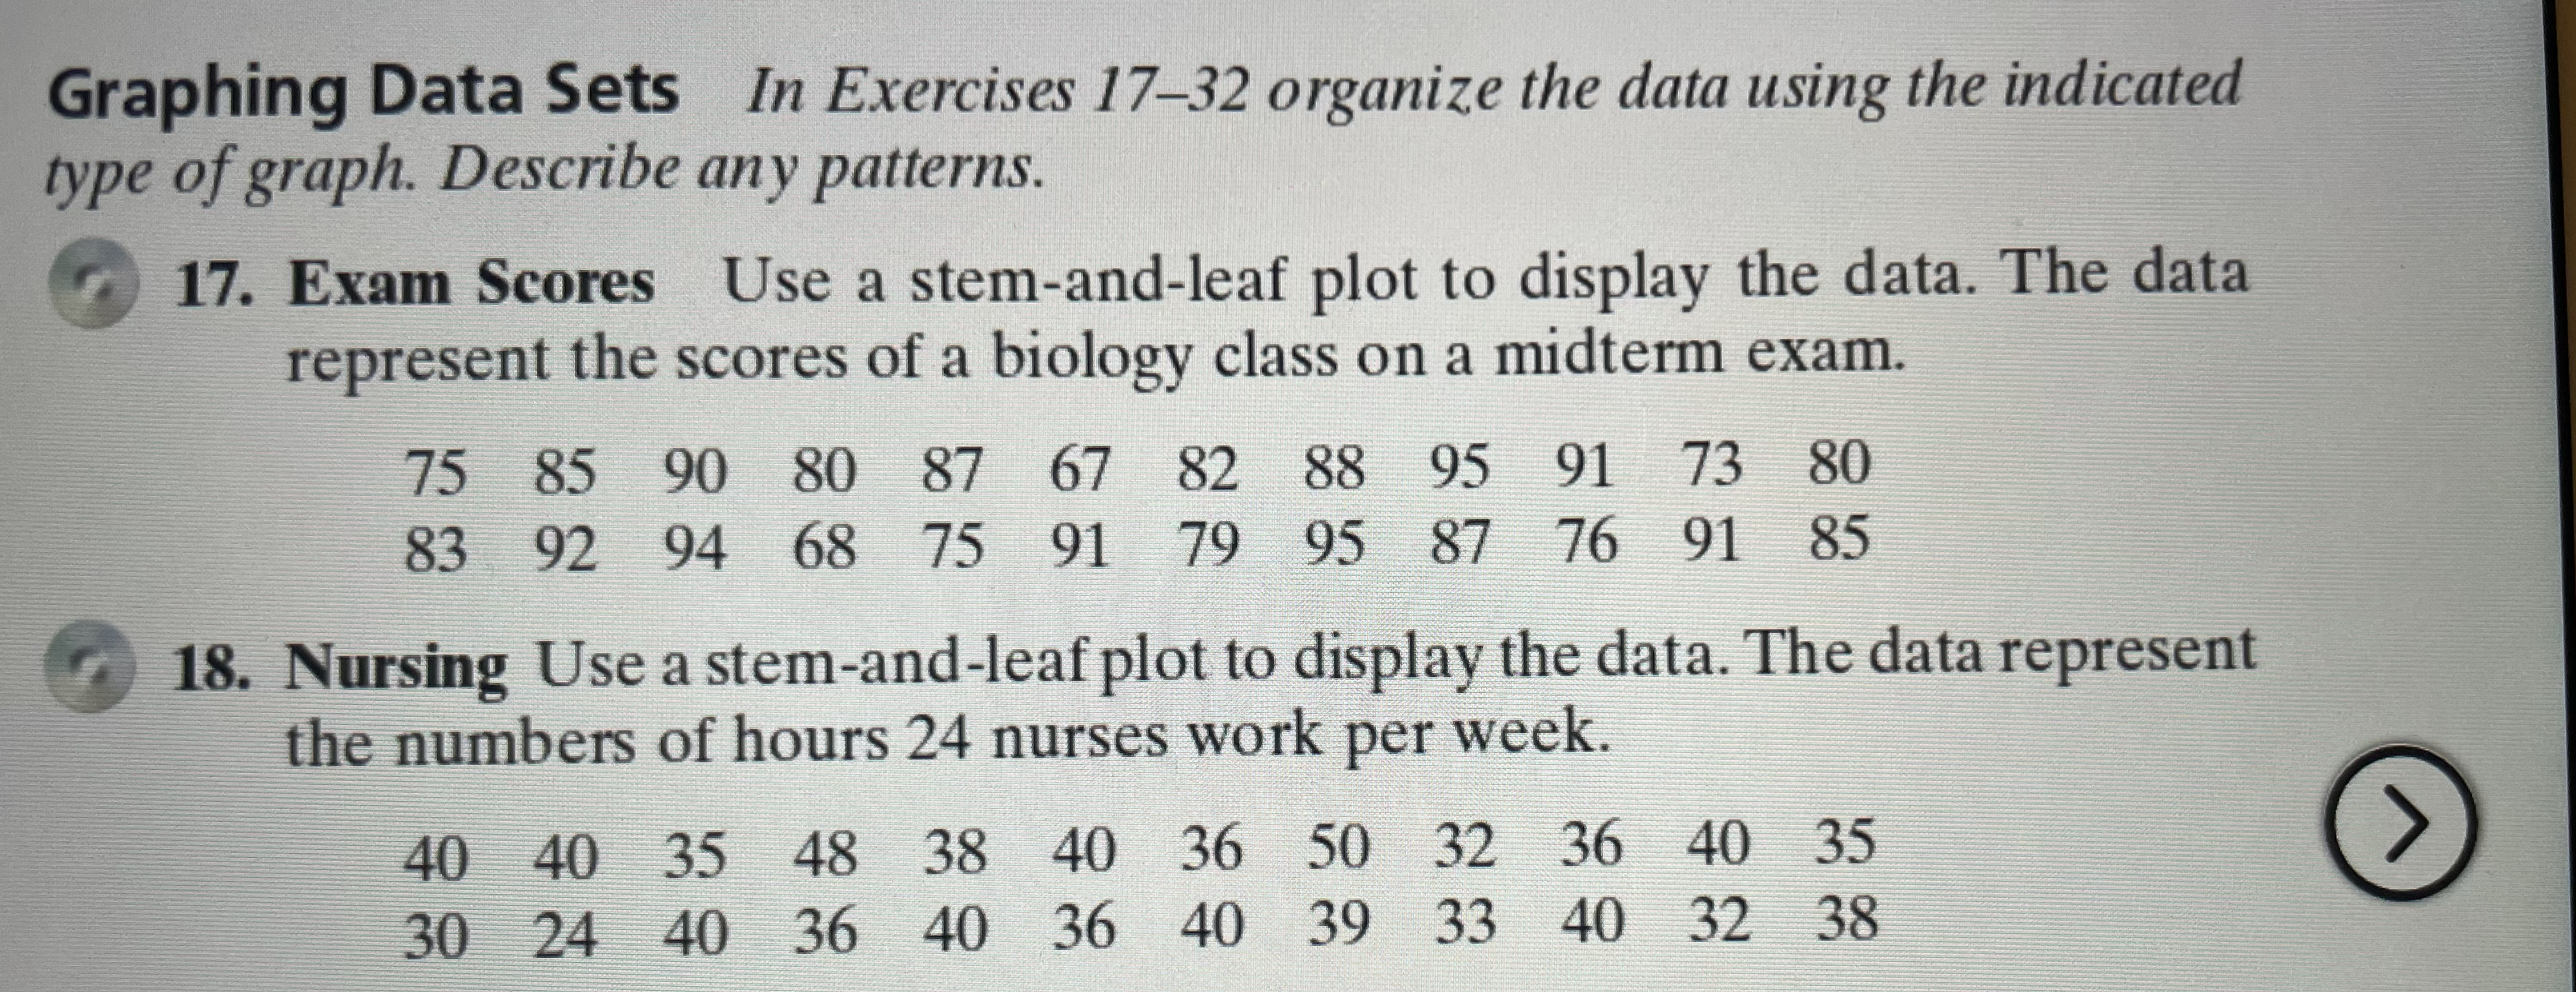
Putting Graphs in Context In Exercises 5-8, match the plot with the description of the sample. 5. 0 8 Key: 0 8 = 0.8 6. 6 78 Key: 6 7 = 67 1 568 7 455888 1345 8 1355889 3 09 9 00024 4 0 0 7. 8. 5 10 15 20 25 30 354 > 200 205 210 215 220 (a) Times (in minutes) it takes a sample of employees to drive to work (b) Grade point averages of a sample of students with finance majors (c) Top speeds (in miles per hour) of a sample of high-performance sports cars (d) Ages (in years) of a sample of residents of a retirement homeGraphing Data Sets In Exercises 17-32 organize the data using the indicated type of graph. Describe any patterns. 17. Exam Scores Use a stem-and-leaf plot to display the data. The data represent the scores of a biology class on a midterm exam. 75 85 90 80 87 67 82 88 95 91 73 80 83 92 94 68 75 91 79 95 87 76 91 85 18. Nursing Use a stem-and-leaf plot to display the data. The data represent the numbers of hours 24 nurses work per week. 40 40 35 48 38 40 36 50 32 36 40 35 30 24 40 36 40 36 40 39 33 40 32 38
Step by Step Solution
There are 3 Steps involved in it

Get step-by-step solutions from verified subject matter experts