Hello, i need assist on these 10 question and need's to be submitted within one hour tops i would greatly appreciate it thank you
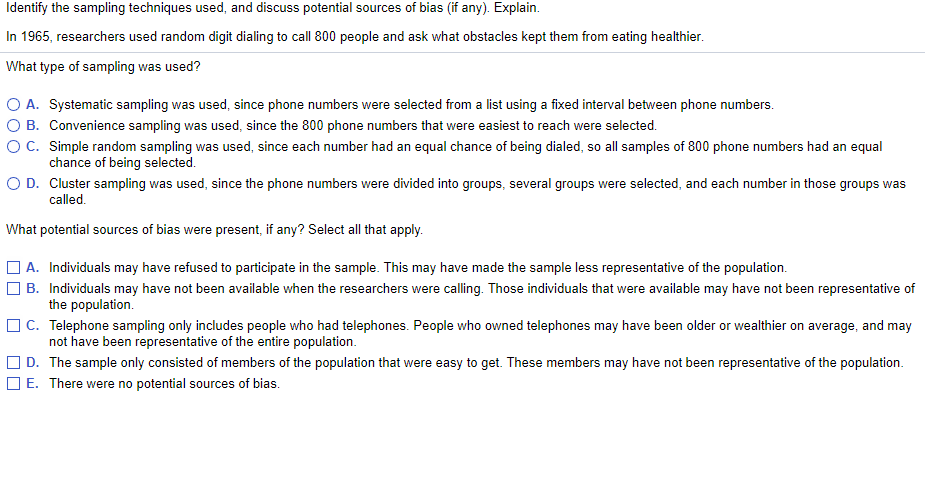
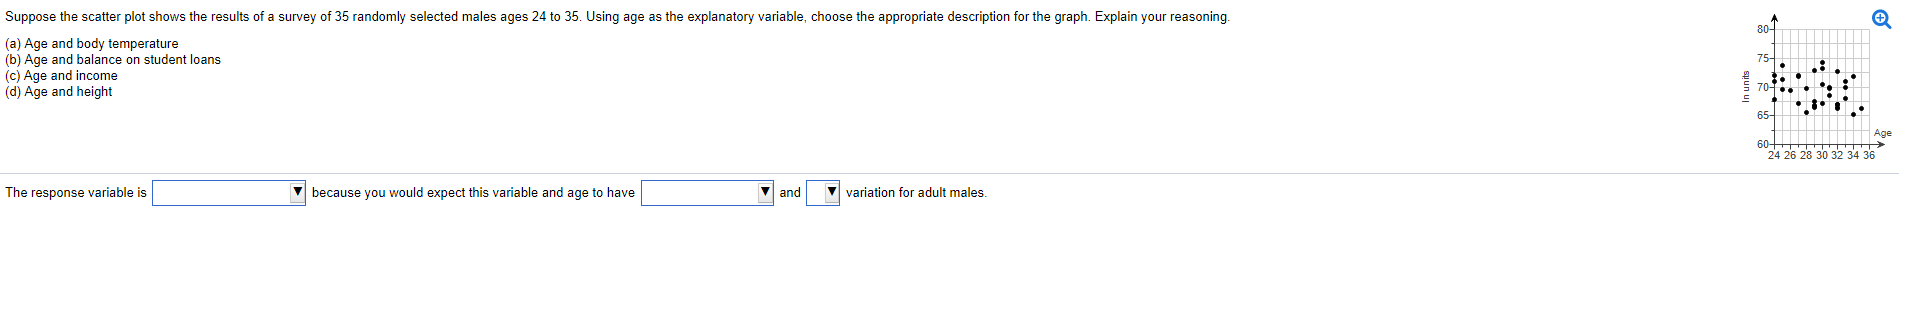
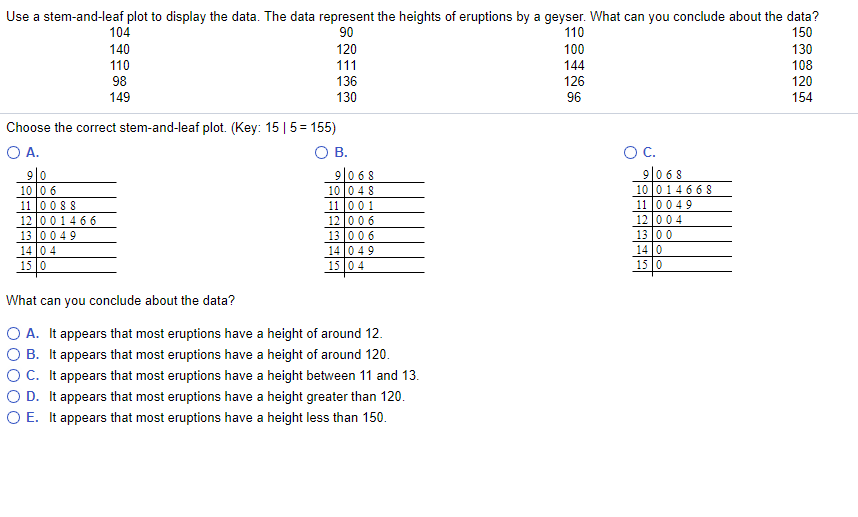
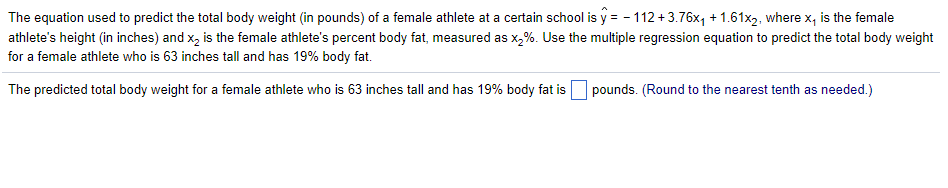
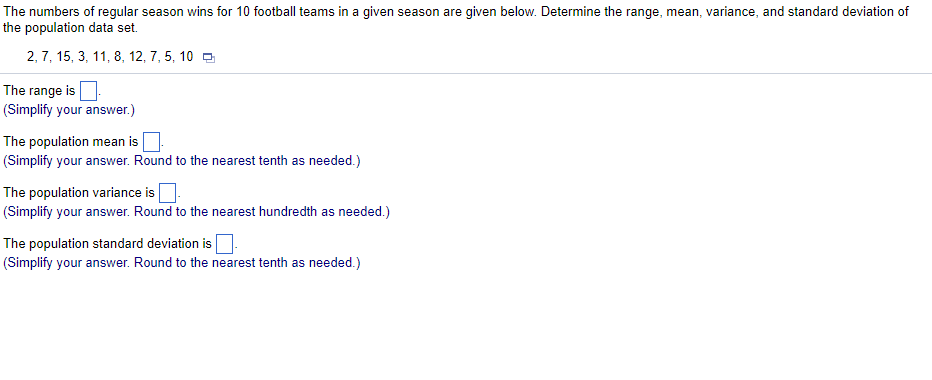
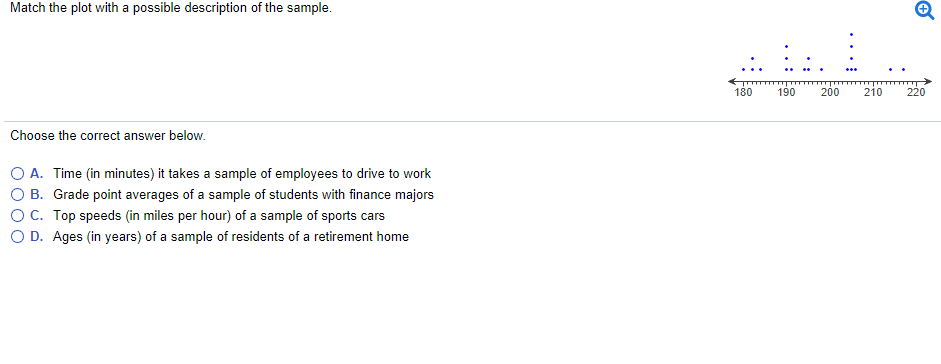
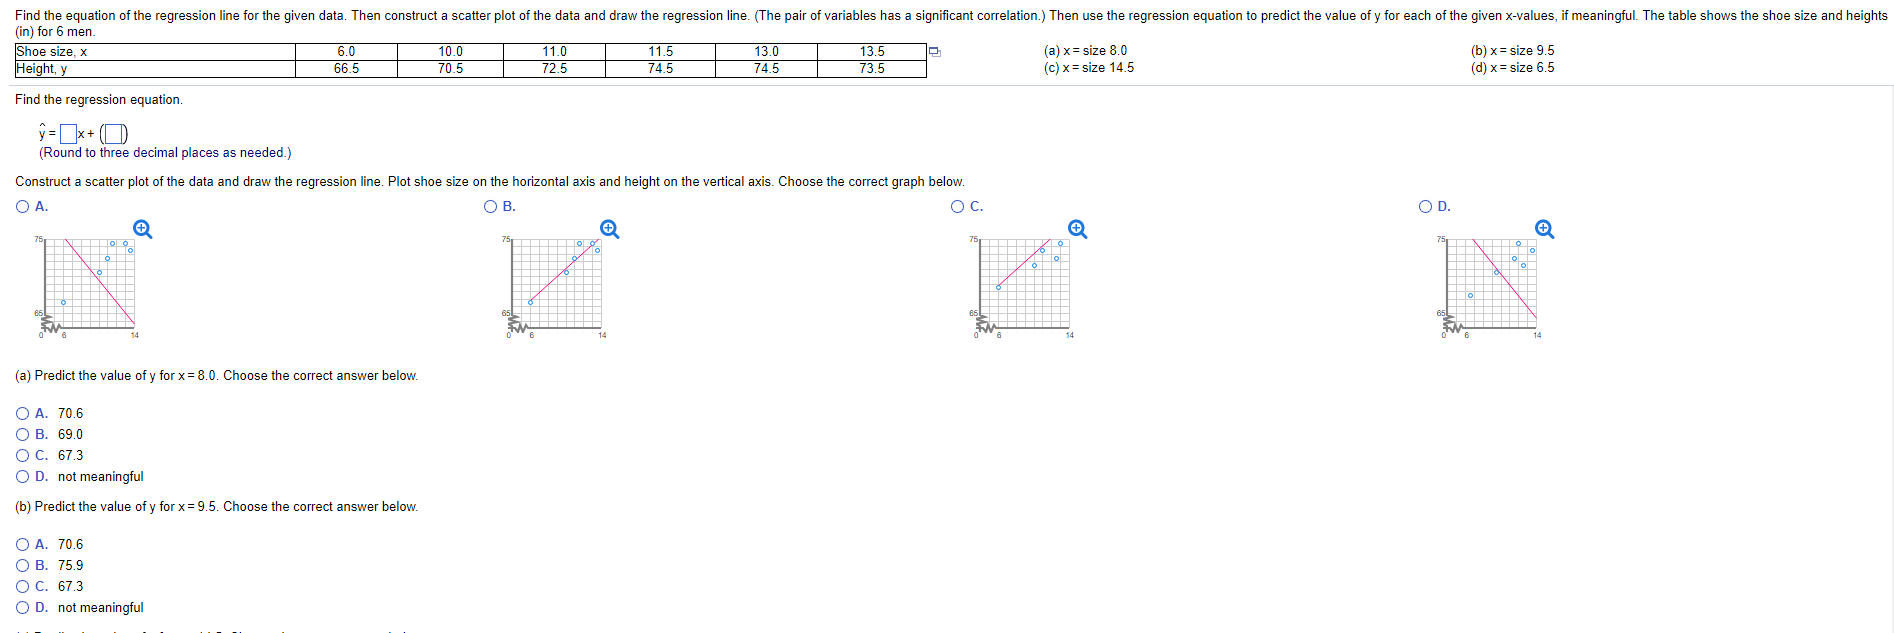
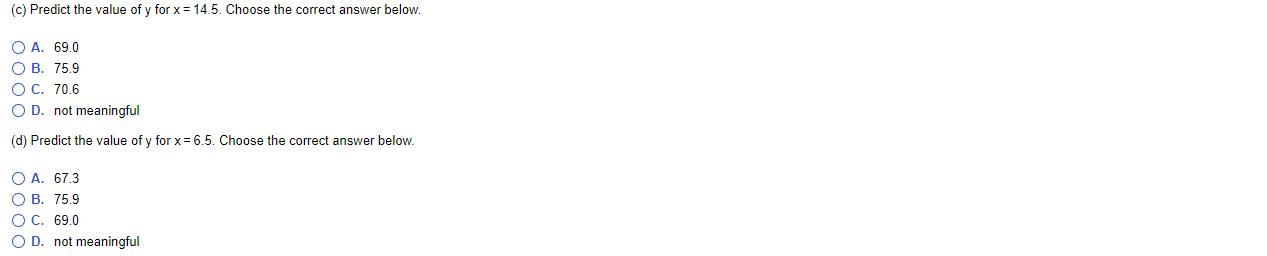
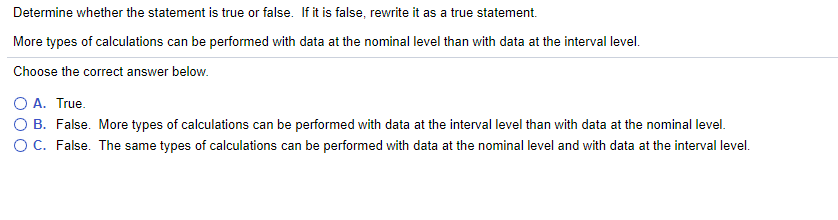
Identify the sampling techniques used, and discuss potential sources of bias [it any}. Explain. In 1985. researchers used random digit dialing to call But] people and ask what obstacles kept them from eating healthier. What type of sampling was used? DA. DE. DC. OD. Systematic sampling was used, since phone numbers were selected from a list using a xed interval between phone numbers. Convenience sampling was used, since the SDI] phone numbers that were easiest to reach were selected. Simple random sampling was used, since each number had an equal chance of being dialed. so all samples of 800 phone numbers had an equal chance of being selected. Cluster sampling was used. since the phone numbers were divided into groups, several groups were selected. and each number in those groups was called. What potential sources ot bias were present, it any? Select all that apply. A. B. '."" Individuals may have refused to participate in The sample. This may have made The sample less representative of the population. Individuals may have not been available when The researchers were calling. Those individuals That were available may have not been representative of the population. Telephone sampling only includes people who had telephones. People who owned telephones may have been older or wealthier on average, and may not have been representative of the entire population. The sample only consisted of members of the population that were easy to get. These members may have not been representative ofthe population. There were no potential sources of bias. Suppnse he snaet p|n| shnwslhe results 0| a survey was randum'y seleded males ages 24in 35 Usmg age as me explanamry variable' chuoselhe apprupnale description furlhe gtaph Explain yaw masnmng (a)Age and body temperame (h)AgE and ha'ance on smdem loans (up Age and inwme (d)Age and height mum: The response variable is v 24262530323436 because you wamd expect mis varia we and age m nave v and V Vanaon Io! adult males. Use a sternandIeaf plot to display the data. The data represent the heights of eruptions by a geyser. What can you conclude about the data? 104 El] 110 151] 140 12!] 100 131] 110 111 144 103 98 135 126 121] 149 130 96 154 Choose the correct stem-and-Ieaf plot. (Key: 15 | 5:155} DE. DC. 9000 9000 10 040 014000 L001 110040 EL 12 004 13 006 00 14 049 140 04 15 0 What can you conclude about the data? C) A. It appears that most eruptions have a height of around 12. O B. It appears that most eruptions have a height of around 120. O C. It appears that most eruptions have a height between 11 and 13. O D. It appears that most eruptions have a height greater than 121]. O E. It appears that most eruptions have a height less than 151]. The equation used to predict the total body weight {in pounds} of a female athlete at a certain school is E = 1 12 +336):1 +1.51x2, where x1 is the female athlete's height [in inches] and x2 is the female athlete's percent body fat. measured as x2%_ Use the multiple regression equation to predict the total bodyr weight for a female athlete who is 53 inches tall and has 19% body fat. The predicted total body weight for a female athlete who is 63 inches tall and has 19% body fat is D pounds. [Round to the nearest tenth as needed.) Determine whether the data set is a population or a sample. Explain your reasoning. The grades of 5 students in a classroom of 30 Choose the correct answer below. 0 A. Sample, because it is a collection of grades for all students in the classroom, but there are other classrooms. O B. Sample, because the collection of 5 students' grades is a subset of all students in the class. C) C. Population, because it is a subset of all students in the class. 0 D. Population, because it is a collection of grades for all students in the classroom. Determine whether the undertined numerical value is a parameter or a statistic. Explain your reasoning. A certain zoo found that it: of its 843 animals were noctumal. rChoose the correct answer below. O A. Statistic, because the data set ofall 843 animals in a zoo is a population. CI B. Parameter, because the data set of all 343 animals in a zoo is a sample. C} C. Parameter, because the data set of a sample of animals in a zoo is a sample. C} D. Statistic, because the data set of a sample of animals in a zoo is a population. O E. Statistic, because the data set ofa sample of animals in a zoo is a sample. CI F. Statistic, because the data set of all 843 animals in a zoo is a sample. C) (3. Parameter, because the data set of all 843 animals in a zoo is a population. C} H. Parameter, because the data set of a sample of animals in a zoo is a population. The numbers of regular season wins for 10 football teams in a given season are given below. Determine the range. mean, variance. and standard deviation of the population data set. 2. 115.111.33.12]. 5,11] q. The range is D. (Simplify your answer.) The population mean is |:. (Simplify your answer. Round to the nearest tenth as needed.) The population variance is :l. (Simplify your answer. Round to the nearest hundredth as needed.) The population standard deviation is D. [Simplify your answer. Round to the nearest tenth as needed.) Match the plot with a possible description of the sample. Choose the correct answer below. 0 A. Time [in minutes} it takes a sample of employees to drive to work Q B. Grade point averages of a sample of students with nance majors O C. Top speeds {in miles per hour) of a sample of sports cars 0 D. Ages (in years]: of a sample of residents of a retirement home 130 190 200 210 220 Find me equalmn of me regression line furme gwen data men eonsuuu a scaner pln| olme dala and draw me Iegrecswon hue. (The new 0! varianxec has a swgnicanl cunelaunn ) Then use me regmem equaLinn In premcn me vame 0! y for each 0! the given value; it meamngm. The Iable shows me shoe size and neigme (in) for 6 men Shoesize,x 60 1U\" 11\" 11,5 130 I35 Q (a)x: izel] (b)x:5ize95 Haighl' y 665 70 5 72 5 74,5 74 5 73 5 (c) 14 5 (d) x=5ize 5 5 Find lhe regression equalinn Q : x + (Round (0 Meg demmal places as needed) Conmd a stellar p'ol nf HIE daa and draw "IE regminn line Plat shue size on "IE ha dznma' axis and heighl nn [ha ve rlical axis Choose "IE toned graph below 0 A. O B. O C. E Q E Q ,5 Q (awredm |he va'ue ufyfnrx: s 0 choose Ihe men answer belnw O A. m s O B. 69 0 O c. 67 3 O D. nmmeaningml (hwredm |he va'ue 0mm: 9 5 choose Ihe curred answer belnw O A. m a O E. 75 9 O c. 67 3 o D. nul meaningful (c) Pledict the value of y for x= 14.5. Choose the curled answer belaw. O A. 69.0 0 B. 75.9 0 C. 70.6 0 D. nnl meaningful (d) Predict the va'ue of y forx= 6 5. Choose the correct answer below. 0 A. 67.3 0 B. 75.9 0 C. 69.0 0 D. nnl meaningful Determine whether the statement is true or false. ll it is false, rewrite it as a true statement. More types of calculations can be performed with data at the nominal level than with data at the interval level. IChoose the correct answer below. 0 A. True. 0 B. False. More types of calculations can he performed with data at the interval level than with data at the nominal level. 0 C. False. The same types of calculations can be performed with data at the nominal level and with data at the interval level