

Question
Hello, I need assistance with the below question, explanation, and calculations. I also need to understand the T-test as my calculations prior were incorrect. I


Hello,
I need assistance with the below question, explanation, and calculations.
I also need to understand the T-test as my calculations prior were incorrect. I received a response that says, "The "T-test: Two-Sample Assuming Unequal Variances" function from the Analysis ToolPak should be used, with a column of zeros for the Variable two values." Thanks.
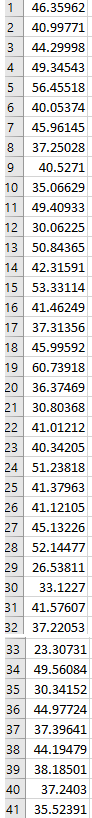
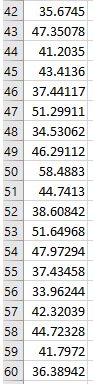
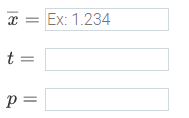
Use Sheet 8 of the Excel file to answer the following questions. A power company is installing utility poles that are supposed to have a height of 40 feet. The foreman checks a random sample of 60 poles to determine if the mean height is 40 feet at a significance level of 0.05. Create a histogram, and calculate x, the t-statistic, and the p-value.
From the histogram, can normality be assumed? Yes or No
Step by Step Solution
There are 3 Steps involved in it
Step: 1

Get Instant Access to Expert-Tailored Solutions
See step-by-step solutions with expert insights and AI powered tools for academic success
Step: 2

Step: 3
Ace Your Homework with AI
Get the answers you need in no time with our AI-driven, step-by-step assistance
Get Started
Discrete Mathematics With Applications
Authors: Susanna S Epp, Robert Gatewood,
4th Edition
1133168663, 9781133168669