

Answered step by step
Verified Expert Solution
Question
1 Approved Answer
Toro Corp. reports the following two years of balance sheets and some additional information. 2019 2018 Cash S 92,915 $ 31,355 Accounts receivable 94,000
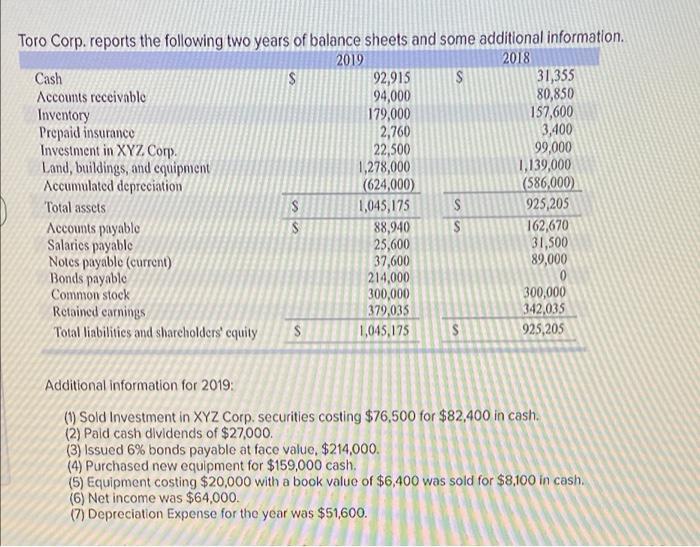
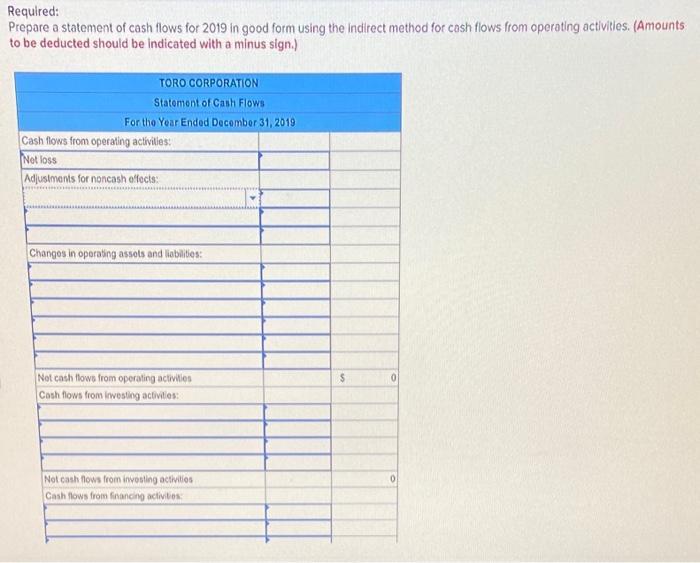
Toro Corp. reports the following two years of balance sheets and some additional information. 2019 2018 Cash S 92,915 $ 31,355 Accounts receivable 94,000 80,850 Inventory 179,000 157,600 Prepaid insurance 2,760 3,400 Investment in XYZ Corp. 22,500 99,000 Land, buildings, and equipment 1,278,000 1,139,000 Accumulated depreciation (624,000) (586,000) Total assets S 1,045,175 Accounts payable S 88,940 SS 925,205 162,670 Salaries payable 25,600 31,500 Notes payable (current) 37,600 89,000 Bonds payable 214,000 Common stock 300,000 300,000 Retained earnings 379,035 342,035 Total liabilities and shareholders' equity S 1,045,175 S 925,205 Additional information for 2019: (1) Sold Investment in XYZ Corp. securities costing $76,500 for $82,400 in cash. (2) Paid cash dividends of $27,000. (3) Issued 6% bonds payable at face value, $214,000. (4) Purchased new equipment for $159,000 cash. (5) Equipment costing $20,000 with a book value of $6,400 was sold for $8,100 in cash. (6) Net income was $64,000. (7) Depreciation Expense for the year was $51,600. Required: Prepare a statement of cash flows for 2019 in good form using the indirect method for cash flows from operating activities. (Amounts to be deducted should be indicated with a minus sign.) TORO CORPORATION Statement of Cash Flows For the Year Ended December 31, 2019 Cash flows from operating activities: Net loss Adjustments for noncash effects: Changes in operating assets and liabilities: Not cash flows from operating activities $ 0 Cash flows from investing activities: Not cash flows from investing activities Cash flows from financing activities 0
Step by Step Solution
There are 3 Steps involved in it
Step: 1
To prepare a statement of cash flows for Toro Corporation for the year ended December 31 2019 using the indirect method we need to follow these steps Start with the net income for the year Adjust for ...
Get Instant Access to Expert-Tailored Solutions
See step-by-step solutions with expert insights and AI powered tools for academic success
Step: 2

Step: 3
Ace Your Homework with AI
Get the answers you need in no time with our AI-driven, step-by-step assistance
Get Started
Financial Management For Public Health And Not For Profit Organizations
Authors: Steven A. Finkler
2nd Edition
0131471988, 978-0131471986