Hello, I need help please
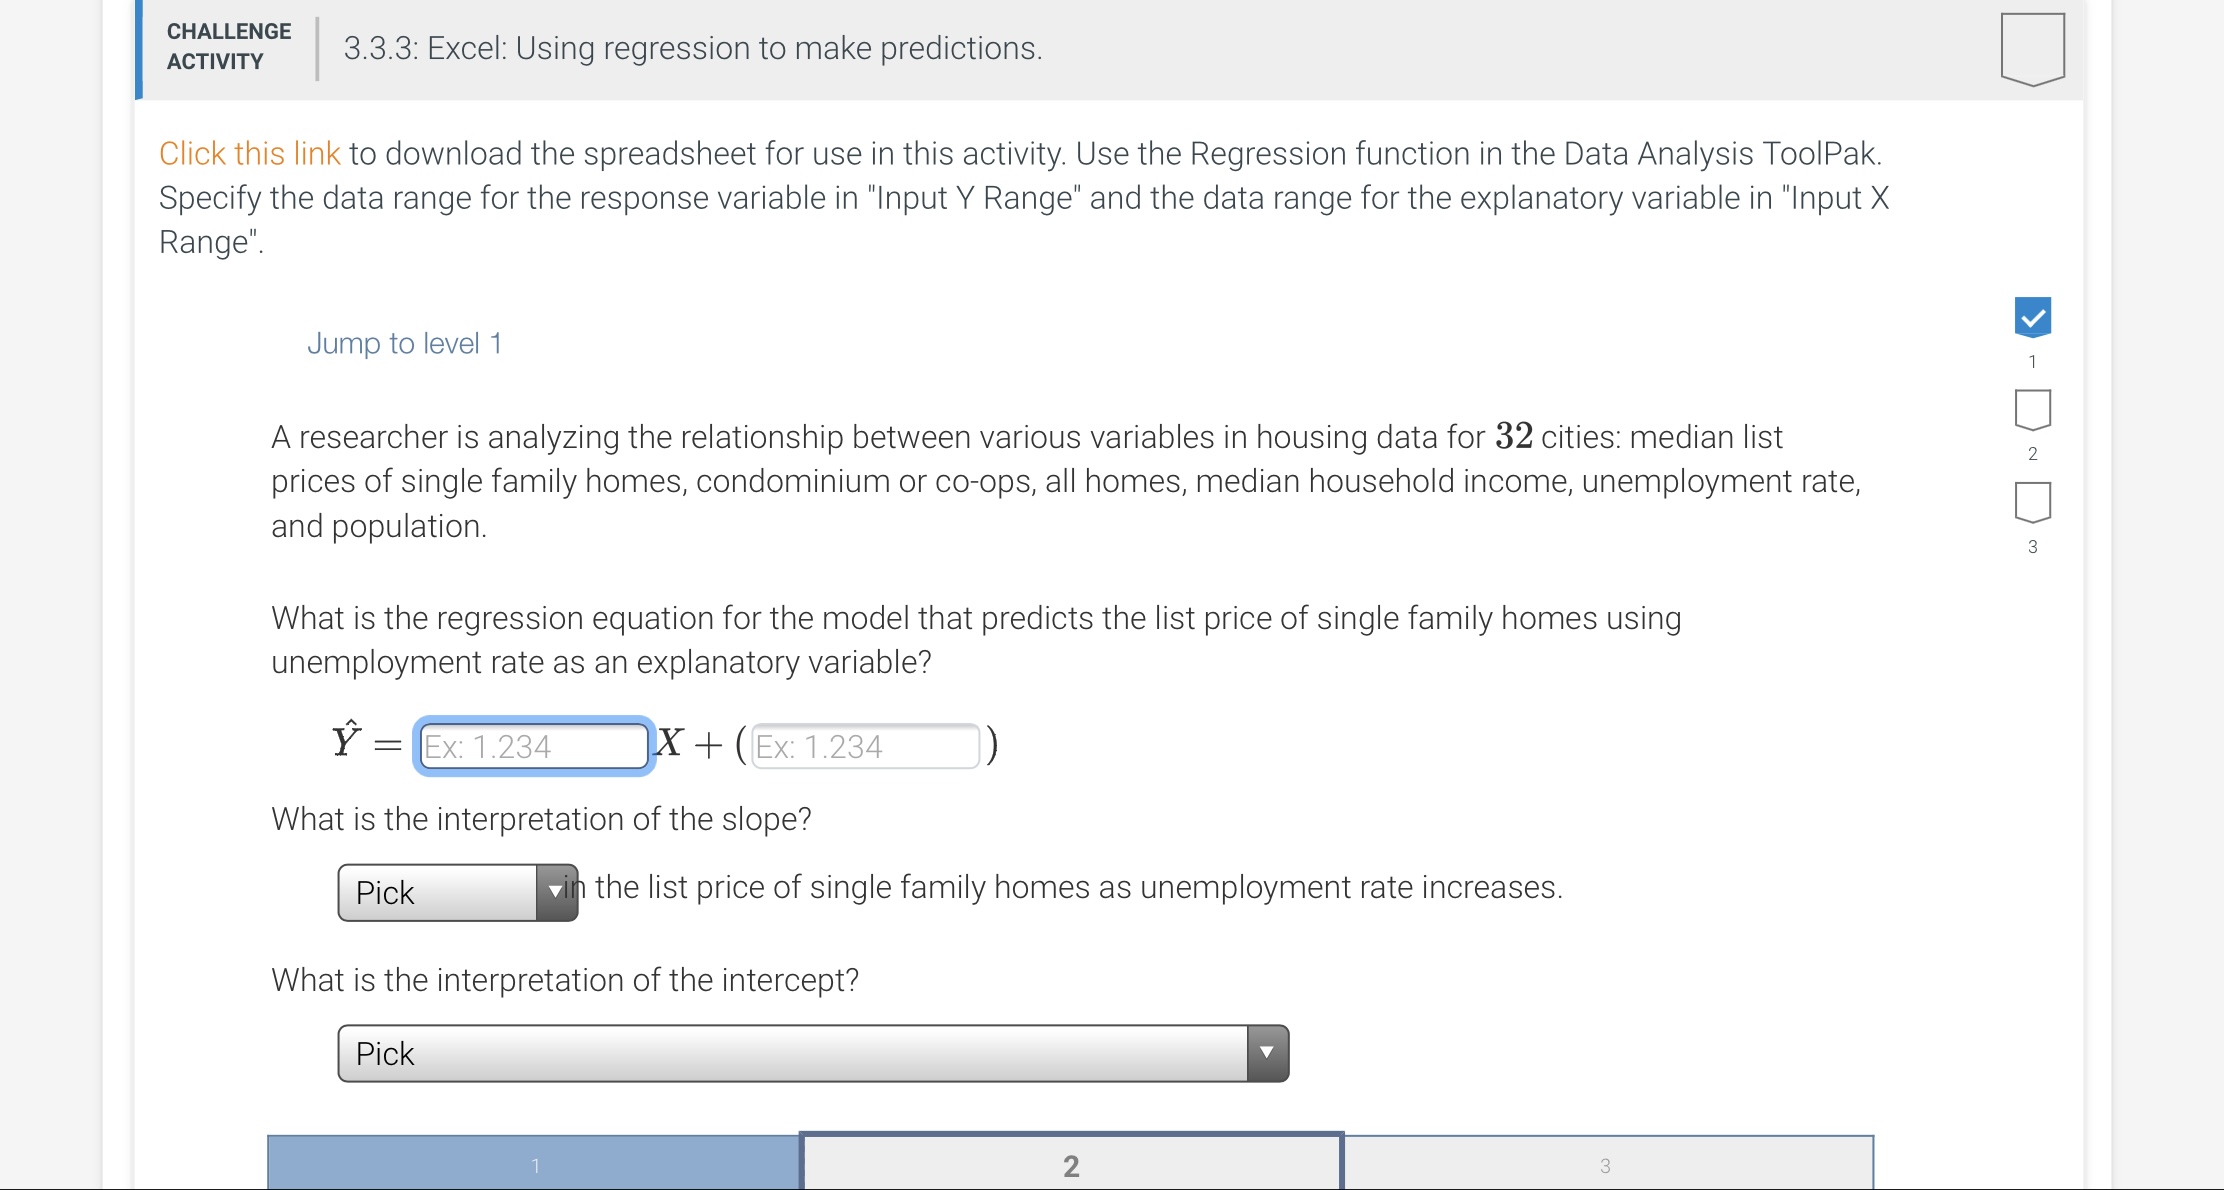
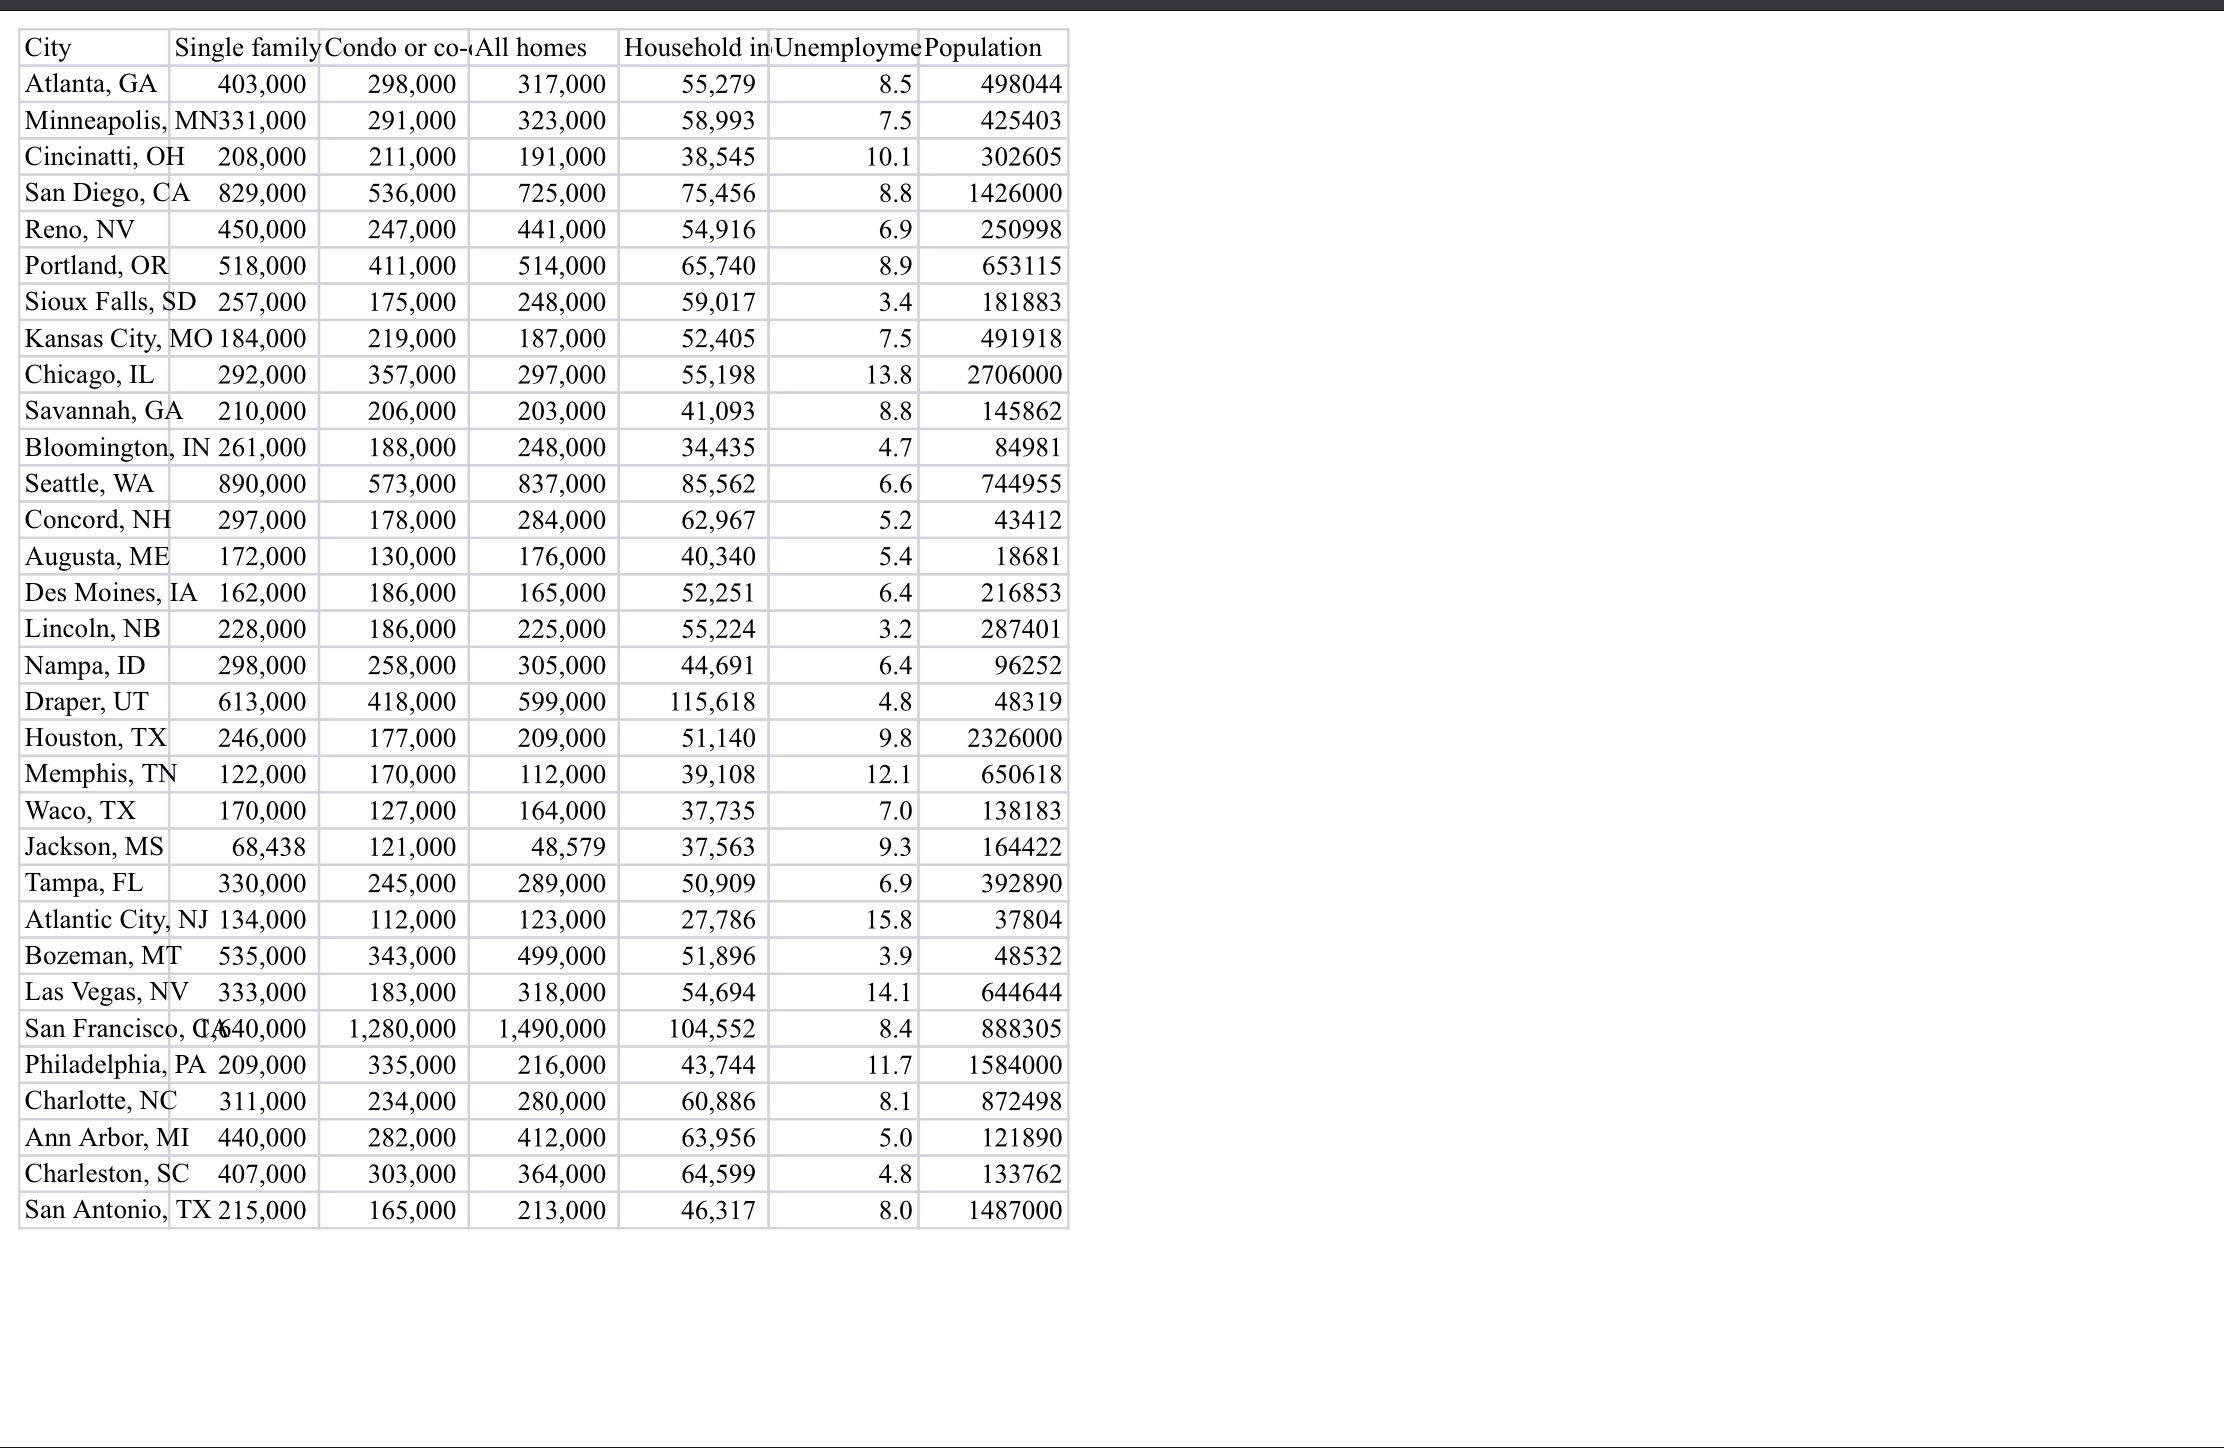
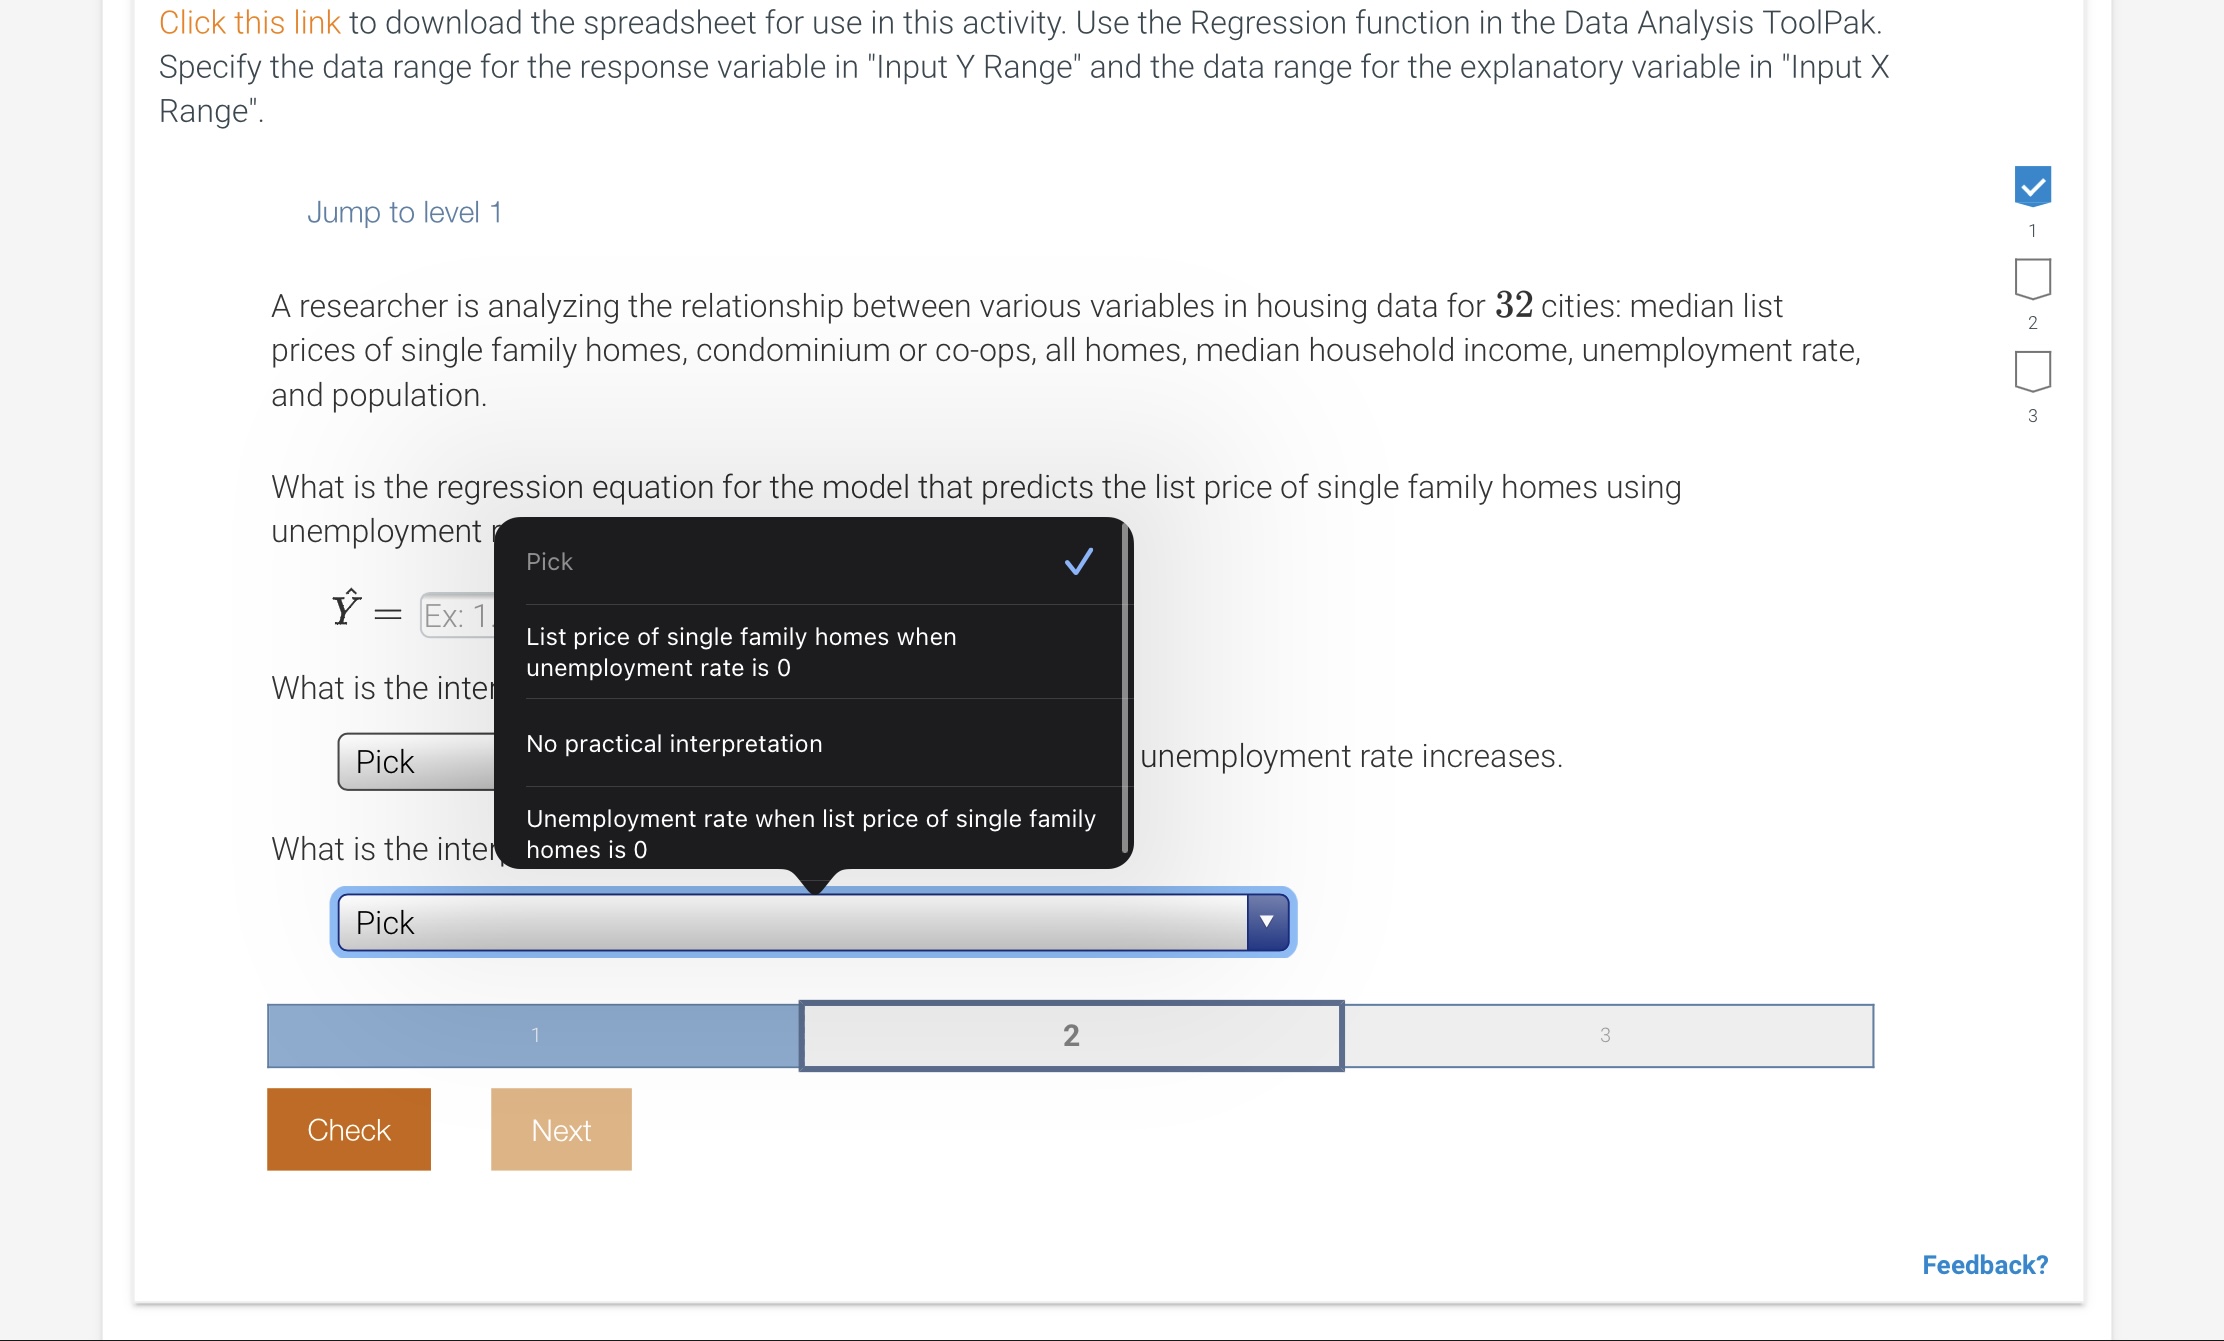
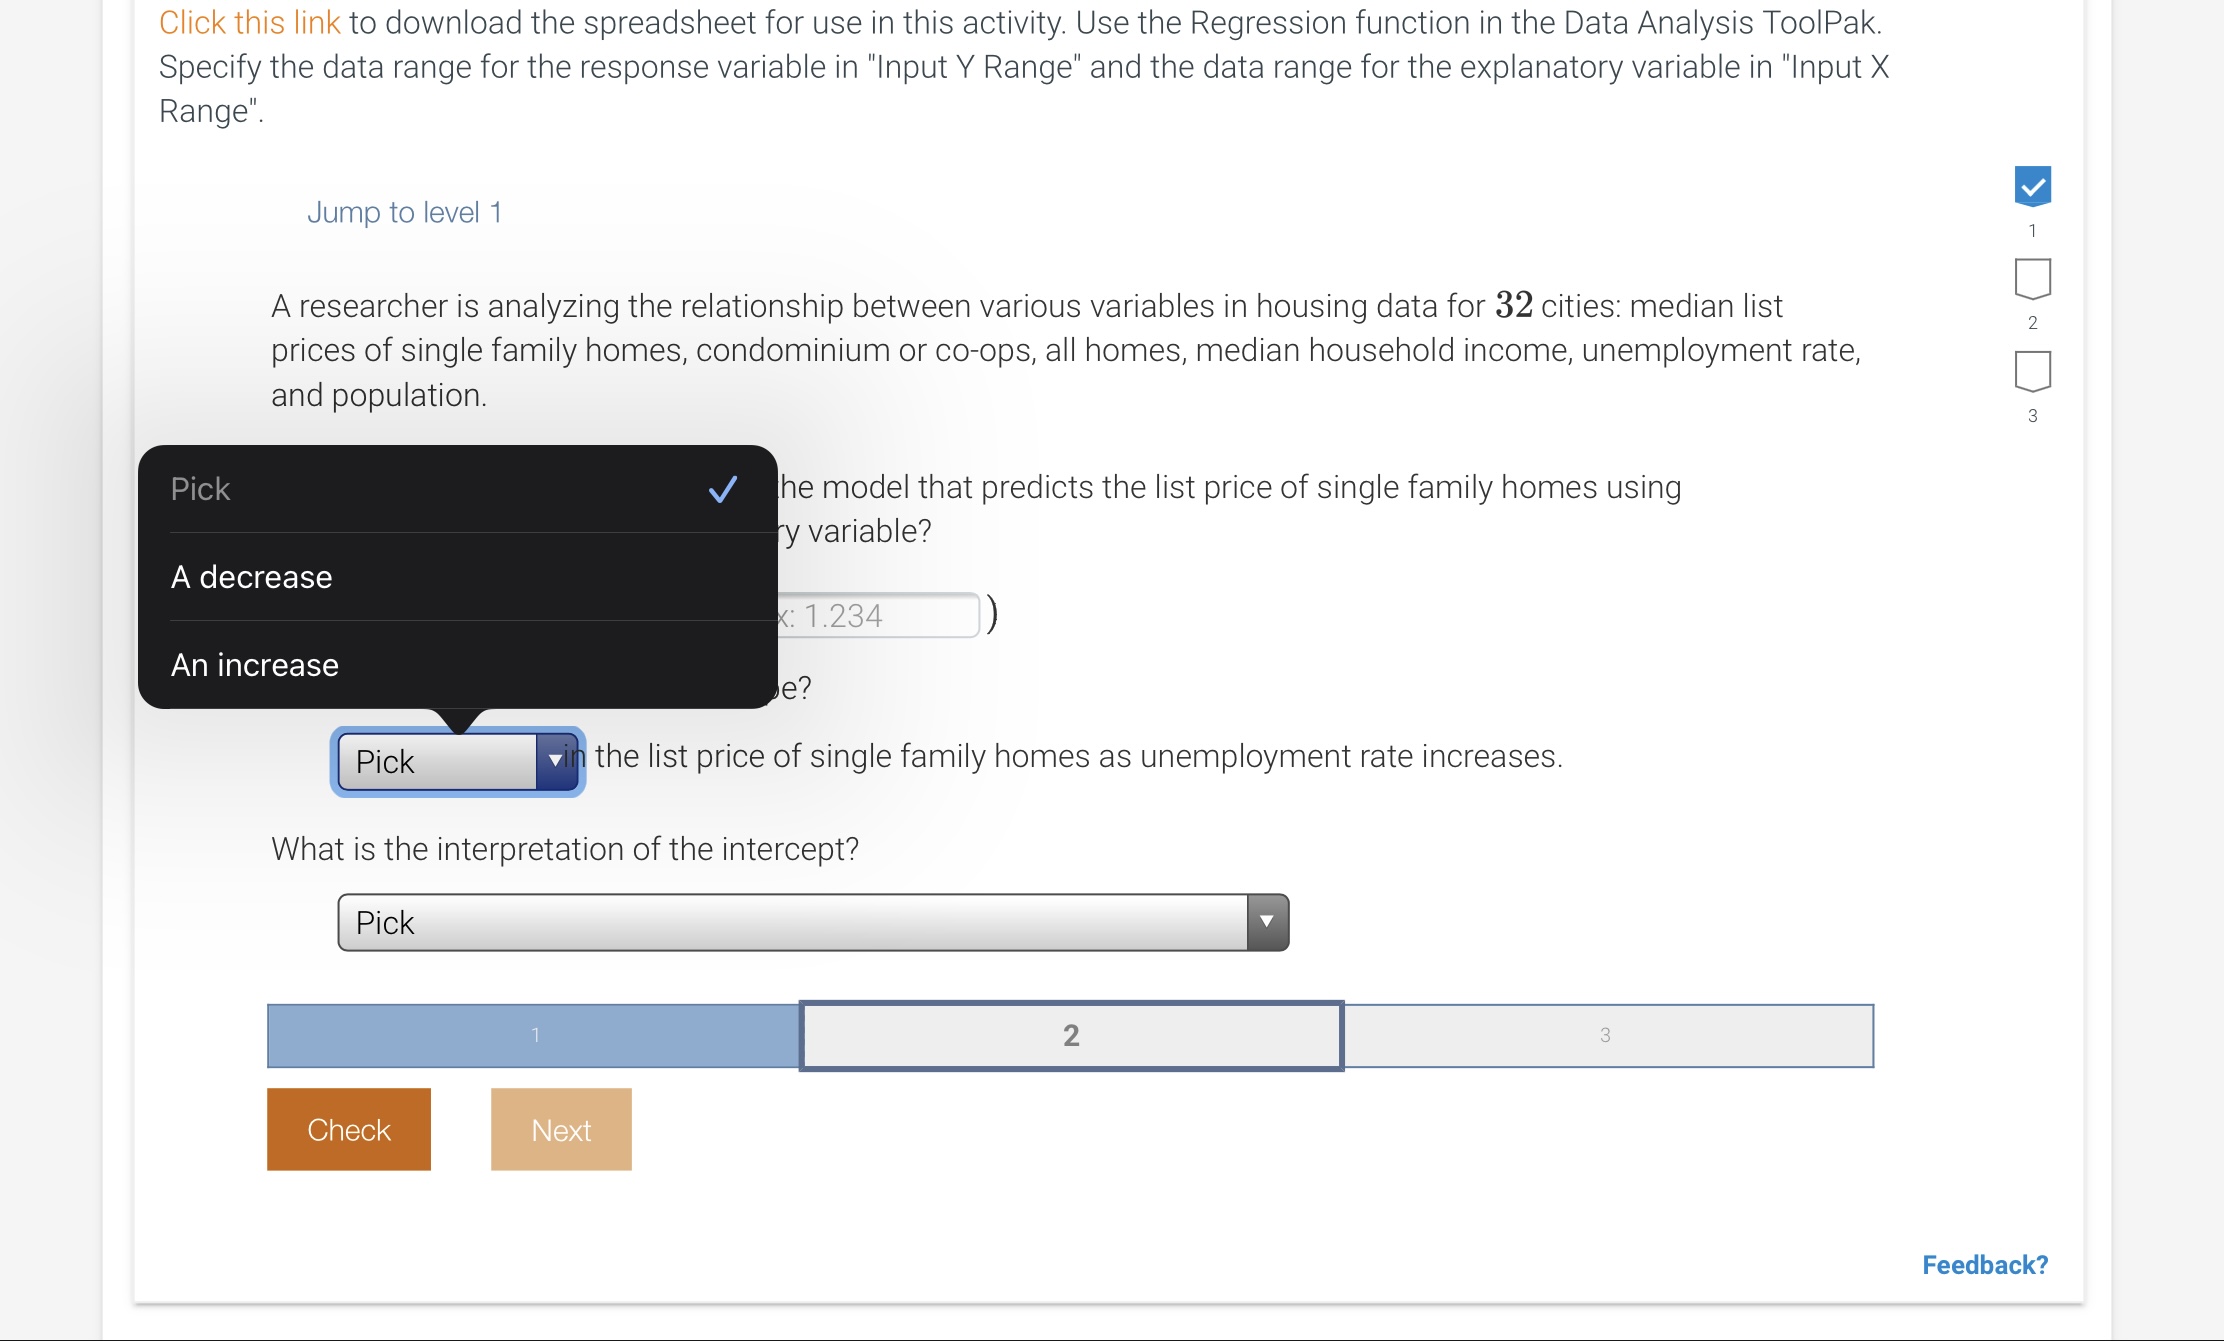
I :33?\" I 333: Excel: Using regression to make predictions Click this link to download the spreadsheet for use in this activity Use the Regression function in the Data Analysis ToolPak. Specify the data range for the response variable in "Input Y Range" and the data range for the explanatory variable in "Input X Range". Jump to level 1 A researcher is analyzing the relationship between various variables in housing data for 32 cities: median list prices of single family homes, condominium or coops, all homes, median household income, unemployment rate, and population. What is the regression equation for the model that predicts the list price of single family homes using unemployment rate as an explanatory variable? Y=-X+(Ex:t.234 ) What is the interpretation of the slope? the list price of single family homes as unemployment rate increases. What is the interpretation ofthe intercept? _ r s WUNUa \fClick this link to download the spreadsheet for use in this activity Use the Regression function in the Data Analysis ToolPak. Specify the data range for the response variable in \"Input Y Range\" and the data range for the explanatory variable in "Input X Range". Jump to level 1 A researcher is analyzing the relationship between various variables in housing data for 32 cities: median list prices of single family homes, condominium or co-ops, all homes, median household income, unemployment rate, and population. What is the regression equation for the model that predicts the list price of single family homes using unemployment ' List price of Single family homes when unemployment rate is 0 What is the inte No practical interpretation unemployment rate increases. Unemployment rate when list price of Single family What is the inte homes IS 0 \"43%:an Feedback? Click this link to download the spreadsheet for use in this activity Use the Regression function in the Data Analysis ToolPak. Specify the data range for the response variable in \"Input Y Range\" and the data range for the explanatory variable in "Input X Range". Jump to level 1 A researcher is analyzing the relationship between various variables in housing data for 32 cities: median list prices of single family homes, condominium or co-ops, all homes, median household income, unemployment rate, and population. WCINCIAK he model that predicts the list price of single family homes using variable? A decrease An increase the list price of single family homes as unemployment rate increases. What is the interpretation of the intercept? _ Feedback