

Answered step by step
Verified Expert Solution
Question
1 Approved Answer
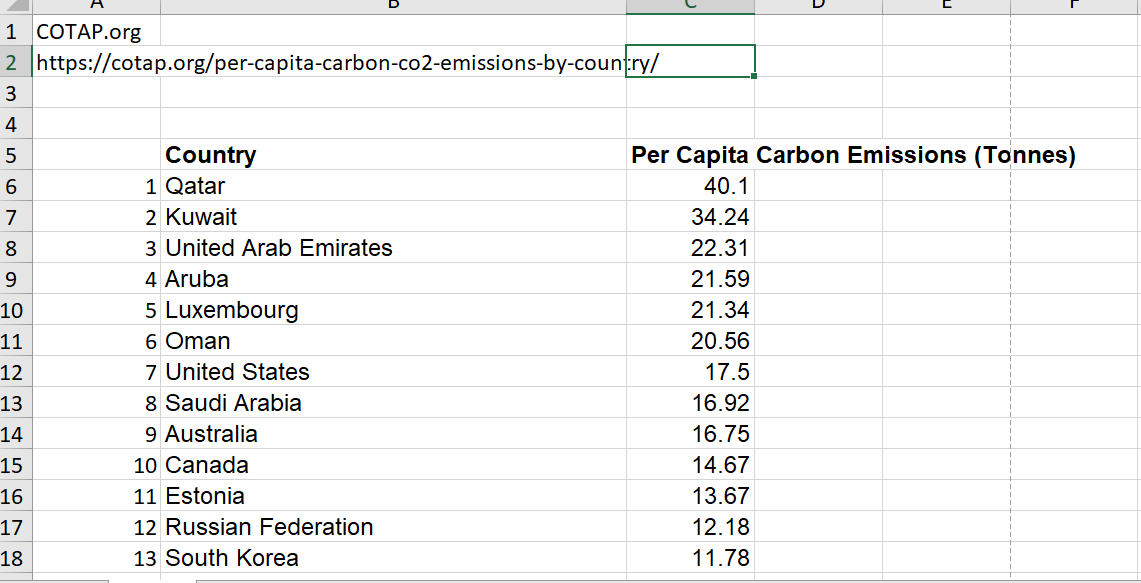
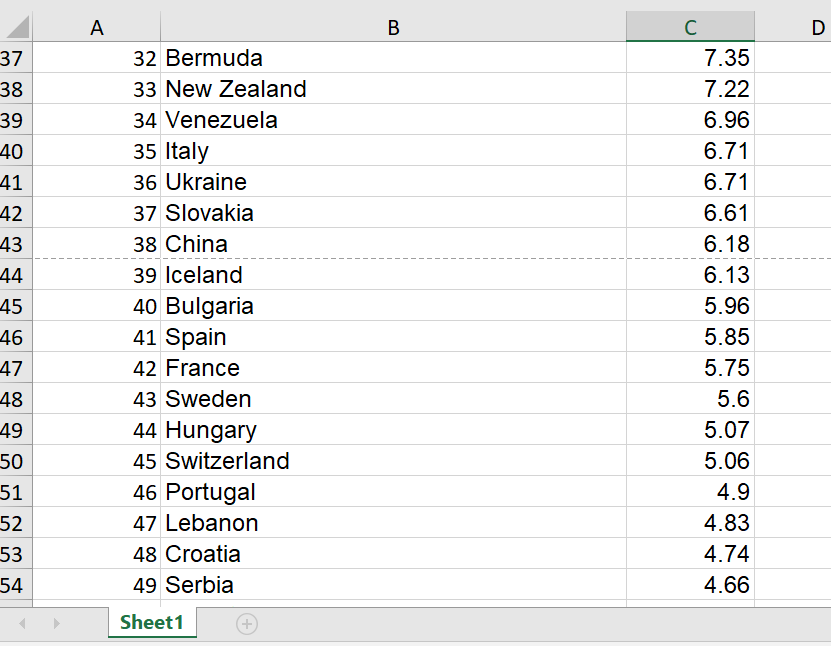
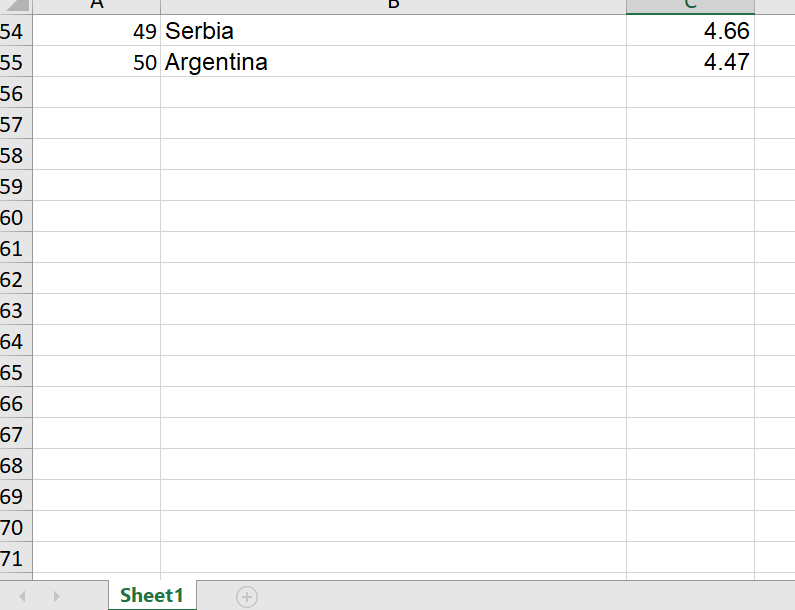
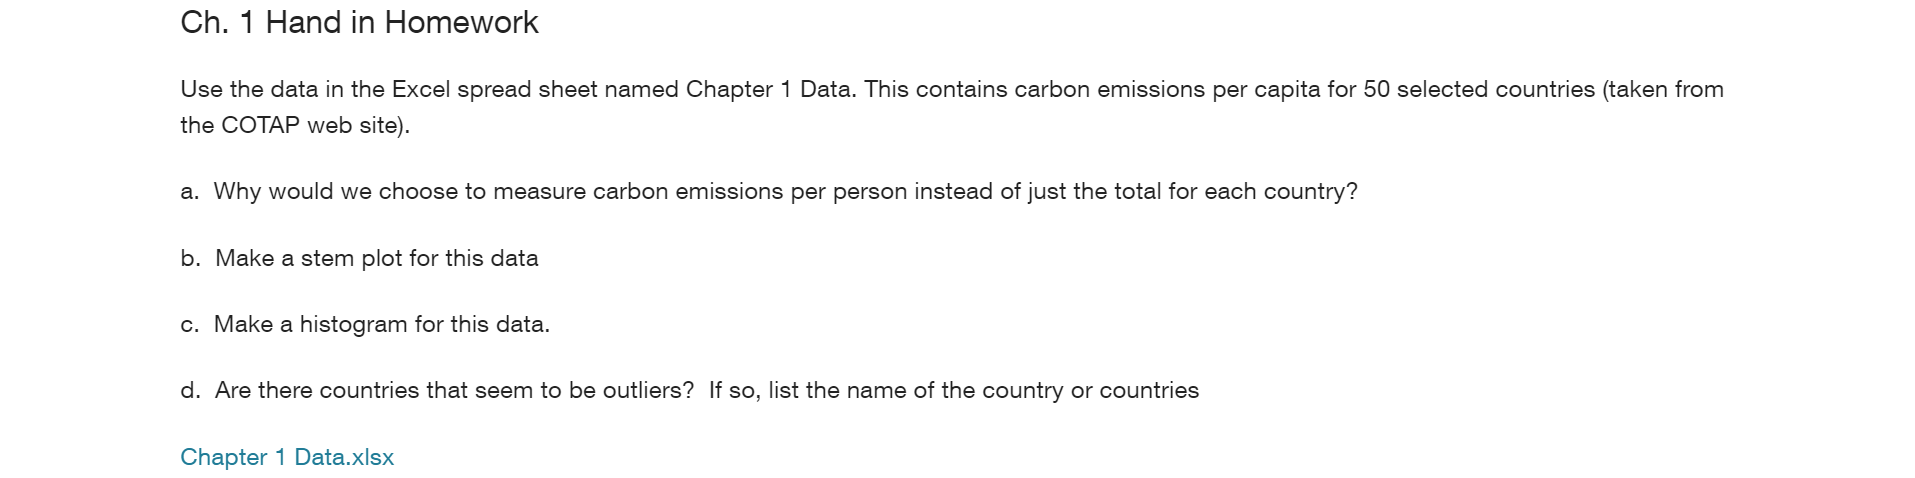
Hello, i need help with the attached excel sheet and questions. thank you. Ch. 1 Hand in Homework Use the data in the Excel spread
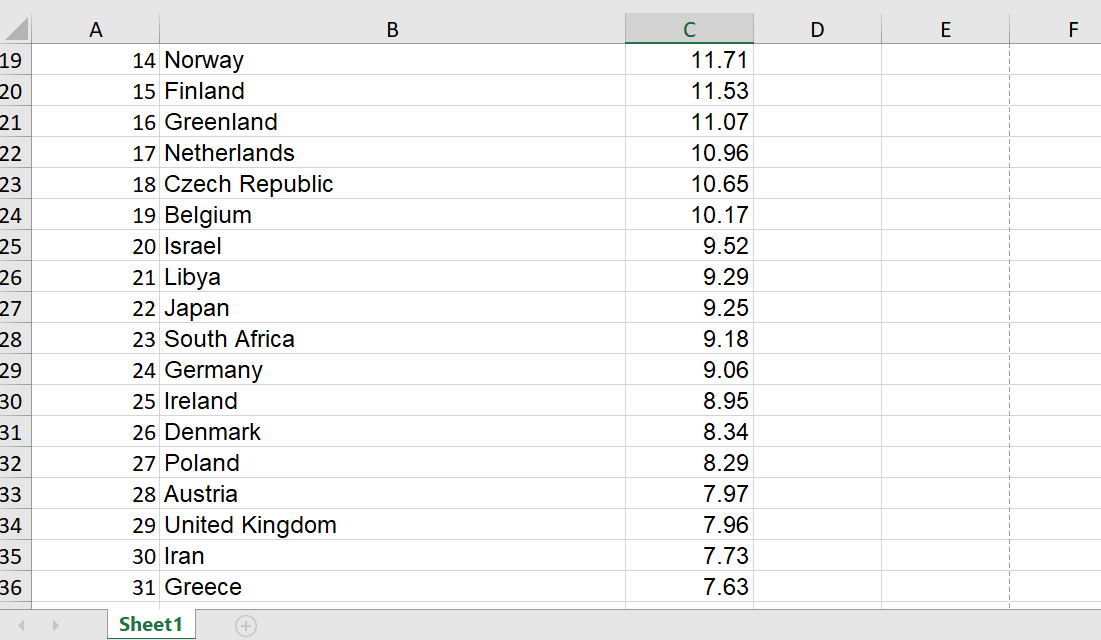


Hello, i need help with the attached excel sheet and questions. thank you.

Step by Step Solution
There are 3 Steps involved in it
Step: 1

Get Instant Access to Expert-Tailored Solutions
See step-by-step solutions with expert insights and AI powered tools for academic success
Step: 2

Step: 3
Ace Your Homework with AI
Get the answers you need in no time with our AI-driven, step-by-step assistance
Get Started
Concepts In Discrete Mathematics
Authors: Mofidul Islam
1st Edition
9353146372, 9789353146375