Answered step by step
Verified Expert Solution
Link Copied!

Question

1 Approved Answer

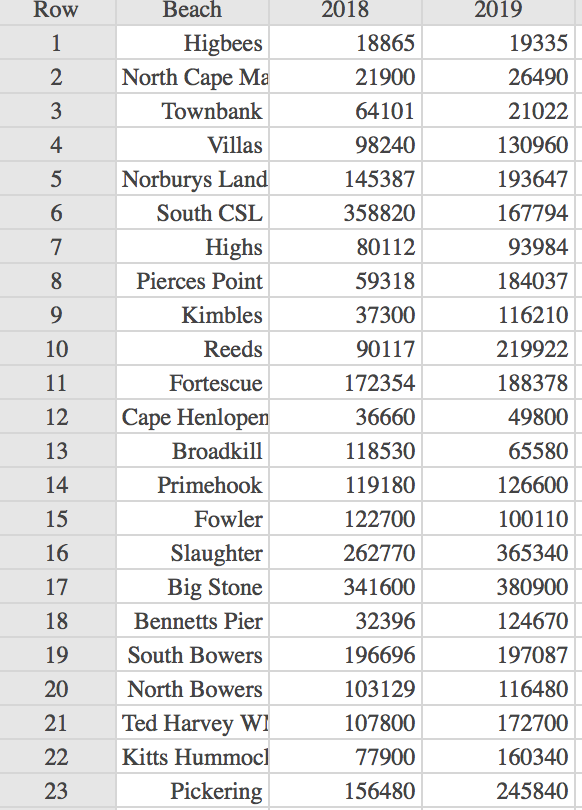
Hello I need help with the following Row Beach 2018 2019 Higbees 18865 19335 2 North Cape Ma 21900 26490 3 Townbank 64101 21022 4

Hello I need help with the following

image text in transcribedimage text in transcribed
Row Beach 2018 2019 Higbees 18865 19335 2 North Cape Ma 21900 26490 3 Townbank 64101 21022 4 Villas 98240 130960 Norburys Land 145387 193647 South CSL 358820 167794 Highs 80112 93984 8 Pierces Point 59318 184037 9 Kimbles 37300 116210 10 Reeds 90117 219922 11 Fortescue 172354 188378 12 Cape Henlopen 36660 49800 13 Broadkill 118530 65580 14 Primehook 119180 126600 15 Fowler 122700 100110 16 Slaughter 262770 365340 17 Big Stone 341600 380900 18 Bennetts Pier 32396 124670 19 South Bowers 196696 197087 20 North Bowers 103129 116480 21 Ted Harvey WI 107800 172700 22 Kitts Hummocl 77900 160340 23 Pickering 156480 245840Volunteers count the number of breeding horseshoe crabs on various beaches along the Delaware Bay each year. A marine biologist questioned whether the population has increased from 2018 to 2019 (i.e. the claim is the population in 2018 is smaller than 2019). The data set used for this problem is called "Horseshoe Crabs Counts on the Delaware Bay. " Assume all conditions hold and use a significance level of 0.10 when you test the hypothesis. a) Calculate the difference between counts by subtracting 2019 from 2018 (i.e. 2018 - 2019). List the difference for each of the pairs in one column in your document. You may calculate these differences in StatCrunch b) Define the population parameter in context in one sentence. c) State the null and alternative hypotheses using correct notation. w d) Obtain the sample mean of these differences and the sample standard deviation of these differences in StatCrunch. You may copy and paste the box that you obtain from StatCrunch or list the values. e) Calculate the test statistic. Please do this "by hand" using the formula and showing your work (please type your work). () Use StatCrunch Stat -> T Stats > Paired and enter 2018 for Sample 1 and 2019 for Sample 2 to verify your test statistic. Copy the output into your document. g) Please correctly present your p-value using probability notation. In addition, state the degrees of freedom for this test. h) State whether you reject or do not reject the null hypothesis and the reason for your decision in one sentence. i) State your conclusion in context of the problem (i.e. interpret your results and or answer the question being posed) in one or two complete sentences

Step by Step Solution

There are 3 Steps involved in it

Step: 1

blur-text-image

Get Instant Access to Expert-Tailored Solutions

See step-by-step solutions with expert insights and AI powered tools for academic success

Step: 2

blur-text-image

Step: 3

blur-text-image

Ace Your Homework with AI

Get the answers you need in no time with our AI-driven, step-by-step assistance

Get Started

Recommended Textbook for

Financial Algebra advanced algebra with financial applications

Authors: Robert K. Gerver

1st edition

978-1285444857, 128544485X, 978-0357229101, 035722910X, 978-0538449670

More Books

Students also viewed these Mathematics questions

Question

Is it possible to achieve equality and fairness in the workplace?

Answered: 1 week ago