Hello. i need help with this problem. i keep getting it wrong
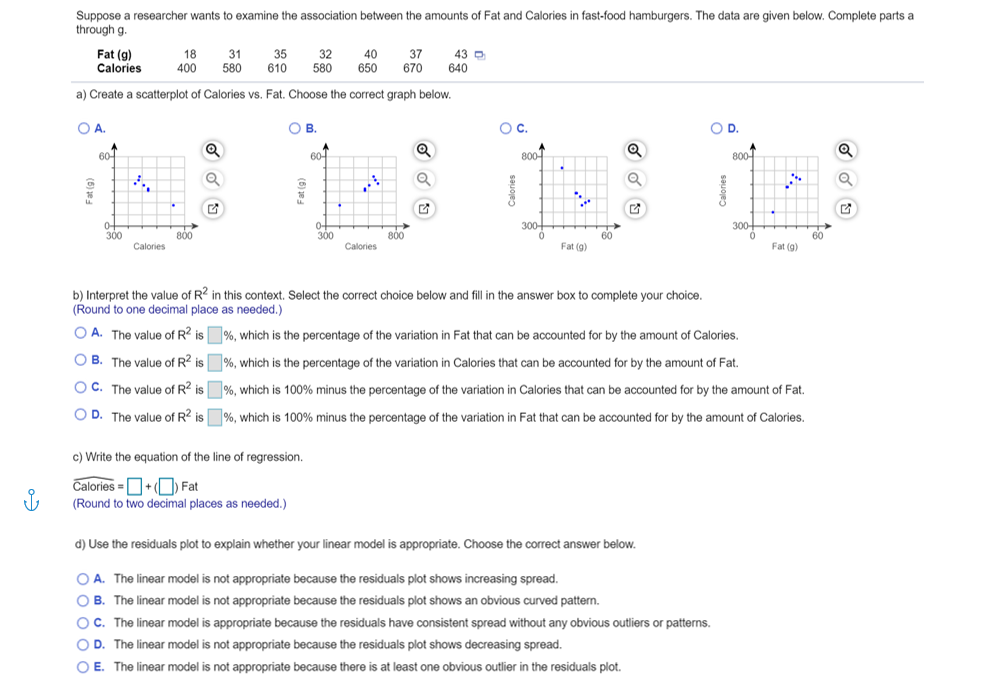
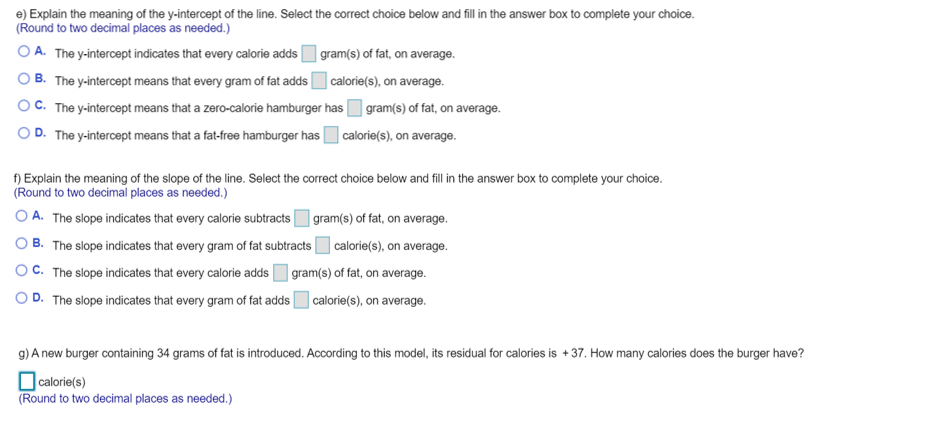
Suppose a researcher wants to examine the association between the amounts of Fat and Calories in fast-food hamburgers. The data are given below. Complete parts a through g. Fat (g) 18 31 35 32 40 37 43 D Calories 400 580 610 580 650 670 640 a) Create a scatterplot of Calories vs. Fat. Choose the correct graph below. O A. O B. O C. O D. 60- 800-T 800T Fat (9) ". . Fat (9) Calories Calories 300 300 300 800 300 800 60 60 Calories Calories Fat (9) Fat (g) b) Interpret the value of R" in this context. Select the correct choice below and fill in the answer box to complete your choice. (Round to one decimal place as needed.) O A. The value of R2 is %, which is the percentage of the variation in Fat that can be accounted for by the amount of Calories. O B. The value of R2 is %, which is the percentage of the variation in Calories that can be accounted for by the amount of Fat. O C. The value of R2 is %, which is 100% minus the percentage of the variation in Calories that can be accounted for by the amount of Fat. O D. The value of R2 is |9%, which is 100% minus the percentage of the variation in Fat that can be accounted for by the amount of Calories. c) Write the equation of the line of regression. Calories = + () Fat (Round to two decimal places as needed.) d) Use the residuals plot to explain whether your linear model is appropriate. Choose the correct answer below. O A. The linear model is not appropriate because the residuals plot shows increasing spread. O B. The linear model is not appropriate because the residuals plot shows an obvious curved pattern. O C. The linear model is appropriate because the residuals have consistent spread without any obvious outliers or patterns. O D. The linear model is not appropriate because the residuals plot shows decreasing spread. O E. The linear model is not appropriate because there is at least one obvious outlier in the residuals plot.e) Explain the meaning of the y-intercept of the line. Select the correct choice below and fill in the answer box to complete your choice. (Round to two decimal places as needed.) O A. The y-intercept indicates that every calorie adds gram(s) of fat, on average. O B. The y-intercept means that every gram of fat adds | |calorie(s), on average. O C. The y-intercept means that a zero-calorie hamburger has gram(s) of fat, on average. O D. The y-intercept means that a fat-free hamburger has calorie(s), on average. f) Explain the meaning of the slope of the line. Select the correct choice below and fill in the answer box to complete your choice. (Round to two decimal places as needed.) O A. The slope indicates that every calorie subtracts gram(s) of fat, on average. O B. The slope indicates that every gram of fat subtracts | calorie(s), on average. O C. The slope indicates that every calorie adds gram(s) of fat, on average. O D. The slope indicates that every gram of fat adds |calorie(s), on average. g) A new burger containing 34 grams of fat is introduced. According to this model, its residual for calories is + 37. How many calories does the burger have? calorie(s) (Round to two decimal places as needed.)


