Answered step by step
Verified Expert Solution
Link Copied!

Question

1 Approved Answer

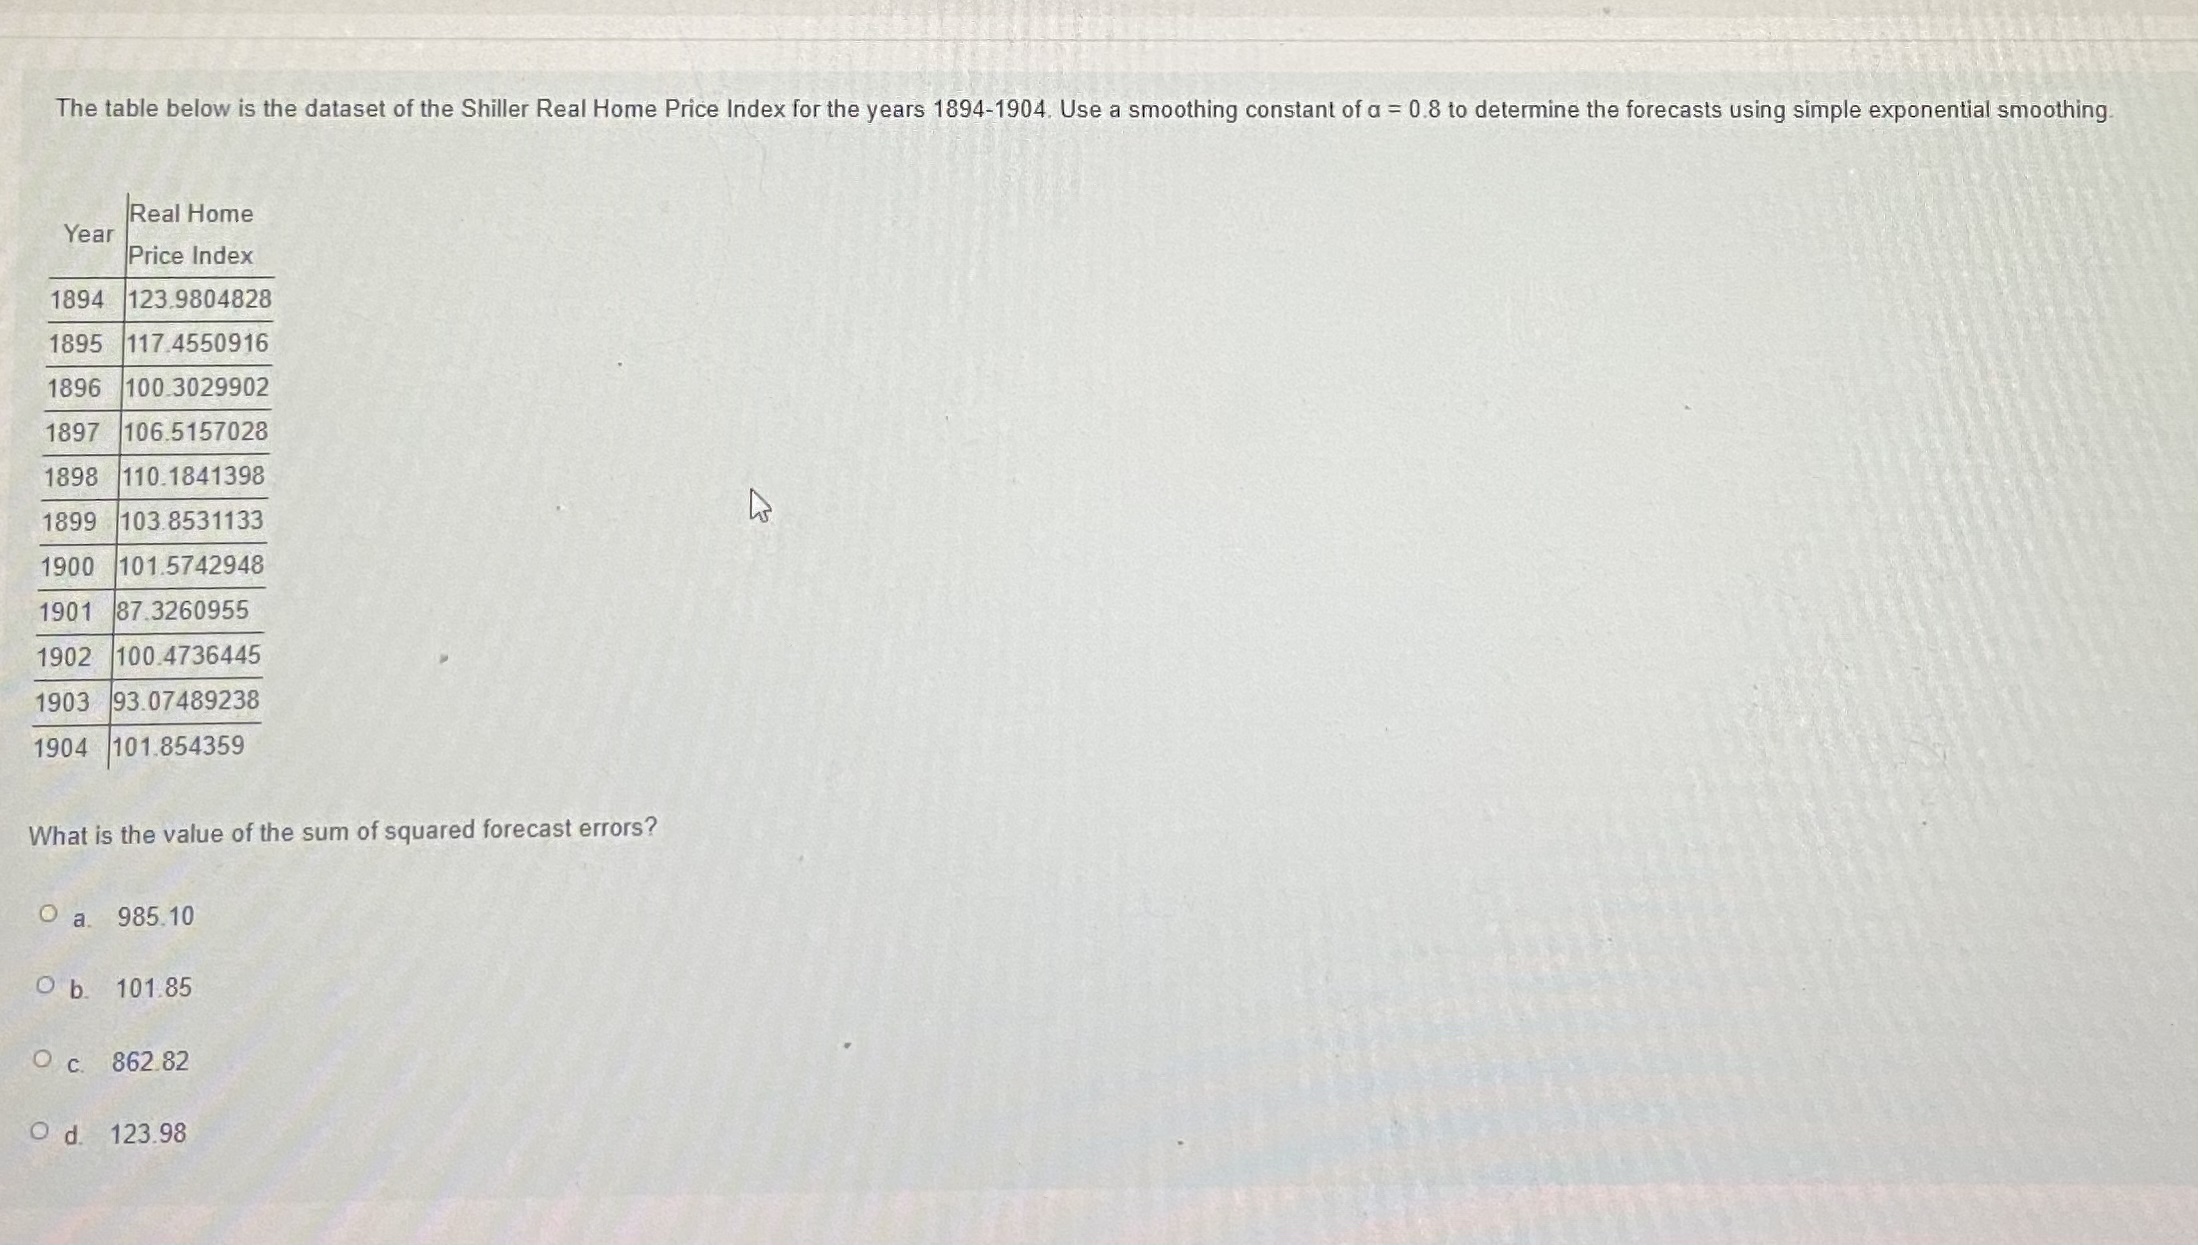
Hello, I would like the answer to this question please. The table below is the dataset of the Shiller Real Home Price Index for the

Hello, I would like the answer to this question please.

image text in transcribed
The table below is the dataset of the Shiller Real Home Price Index for the years 1894-1904. Use a smoothing constant of a = 0.8 to determine the forecasts using simple exponential smoothing Real Home Year Price Index 1894 123.9804828 1895 117 4550916 1896 100.3029902 1897 106.5157028 1898 110.1841398 1899 103.8531133 1900 101.5742948 1901 87.3260955 1902 100.4736445 1903 93.07489238 1904 101.854359 What is the value of the sum of squared forecast errors? O a. 985.10 O b. 101.85 O c. 862 82 O d. 123.98

Step by Step Solution

There are 3 Steps involved in it

Step: 1

blur-text-image

Get Instant Access to Expert-Tailored Solutions

See step-by-step solutions with expert insights and AI powered tools for academic success

Step: 2

blur-text-image

Step: 3

blur-text-image

Ace Your Homework with AI

Get the answers you need in no time with our AI-driven, step-by-step assistance

Get Started

Recommended Textbook for

Commercial Fishing On The Outer Banks

Authors: R Wayne Gray, Nancy Beach Gray

1st Edition

1439667055, 9781439667057

More Books

Students also viewed these Economics questions

Question

=+ (b) Find an example in which A ,, ! A, u( A ,, ) = 00, and A = .

Answered: 1 week ago

Question

How do the events of normal aging affect life satisfaction?

Answered: 1 week ago