Hello,
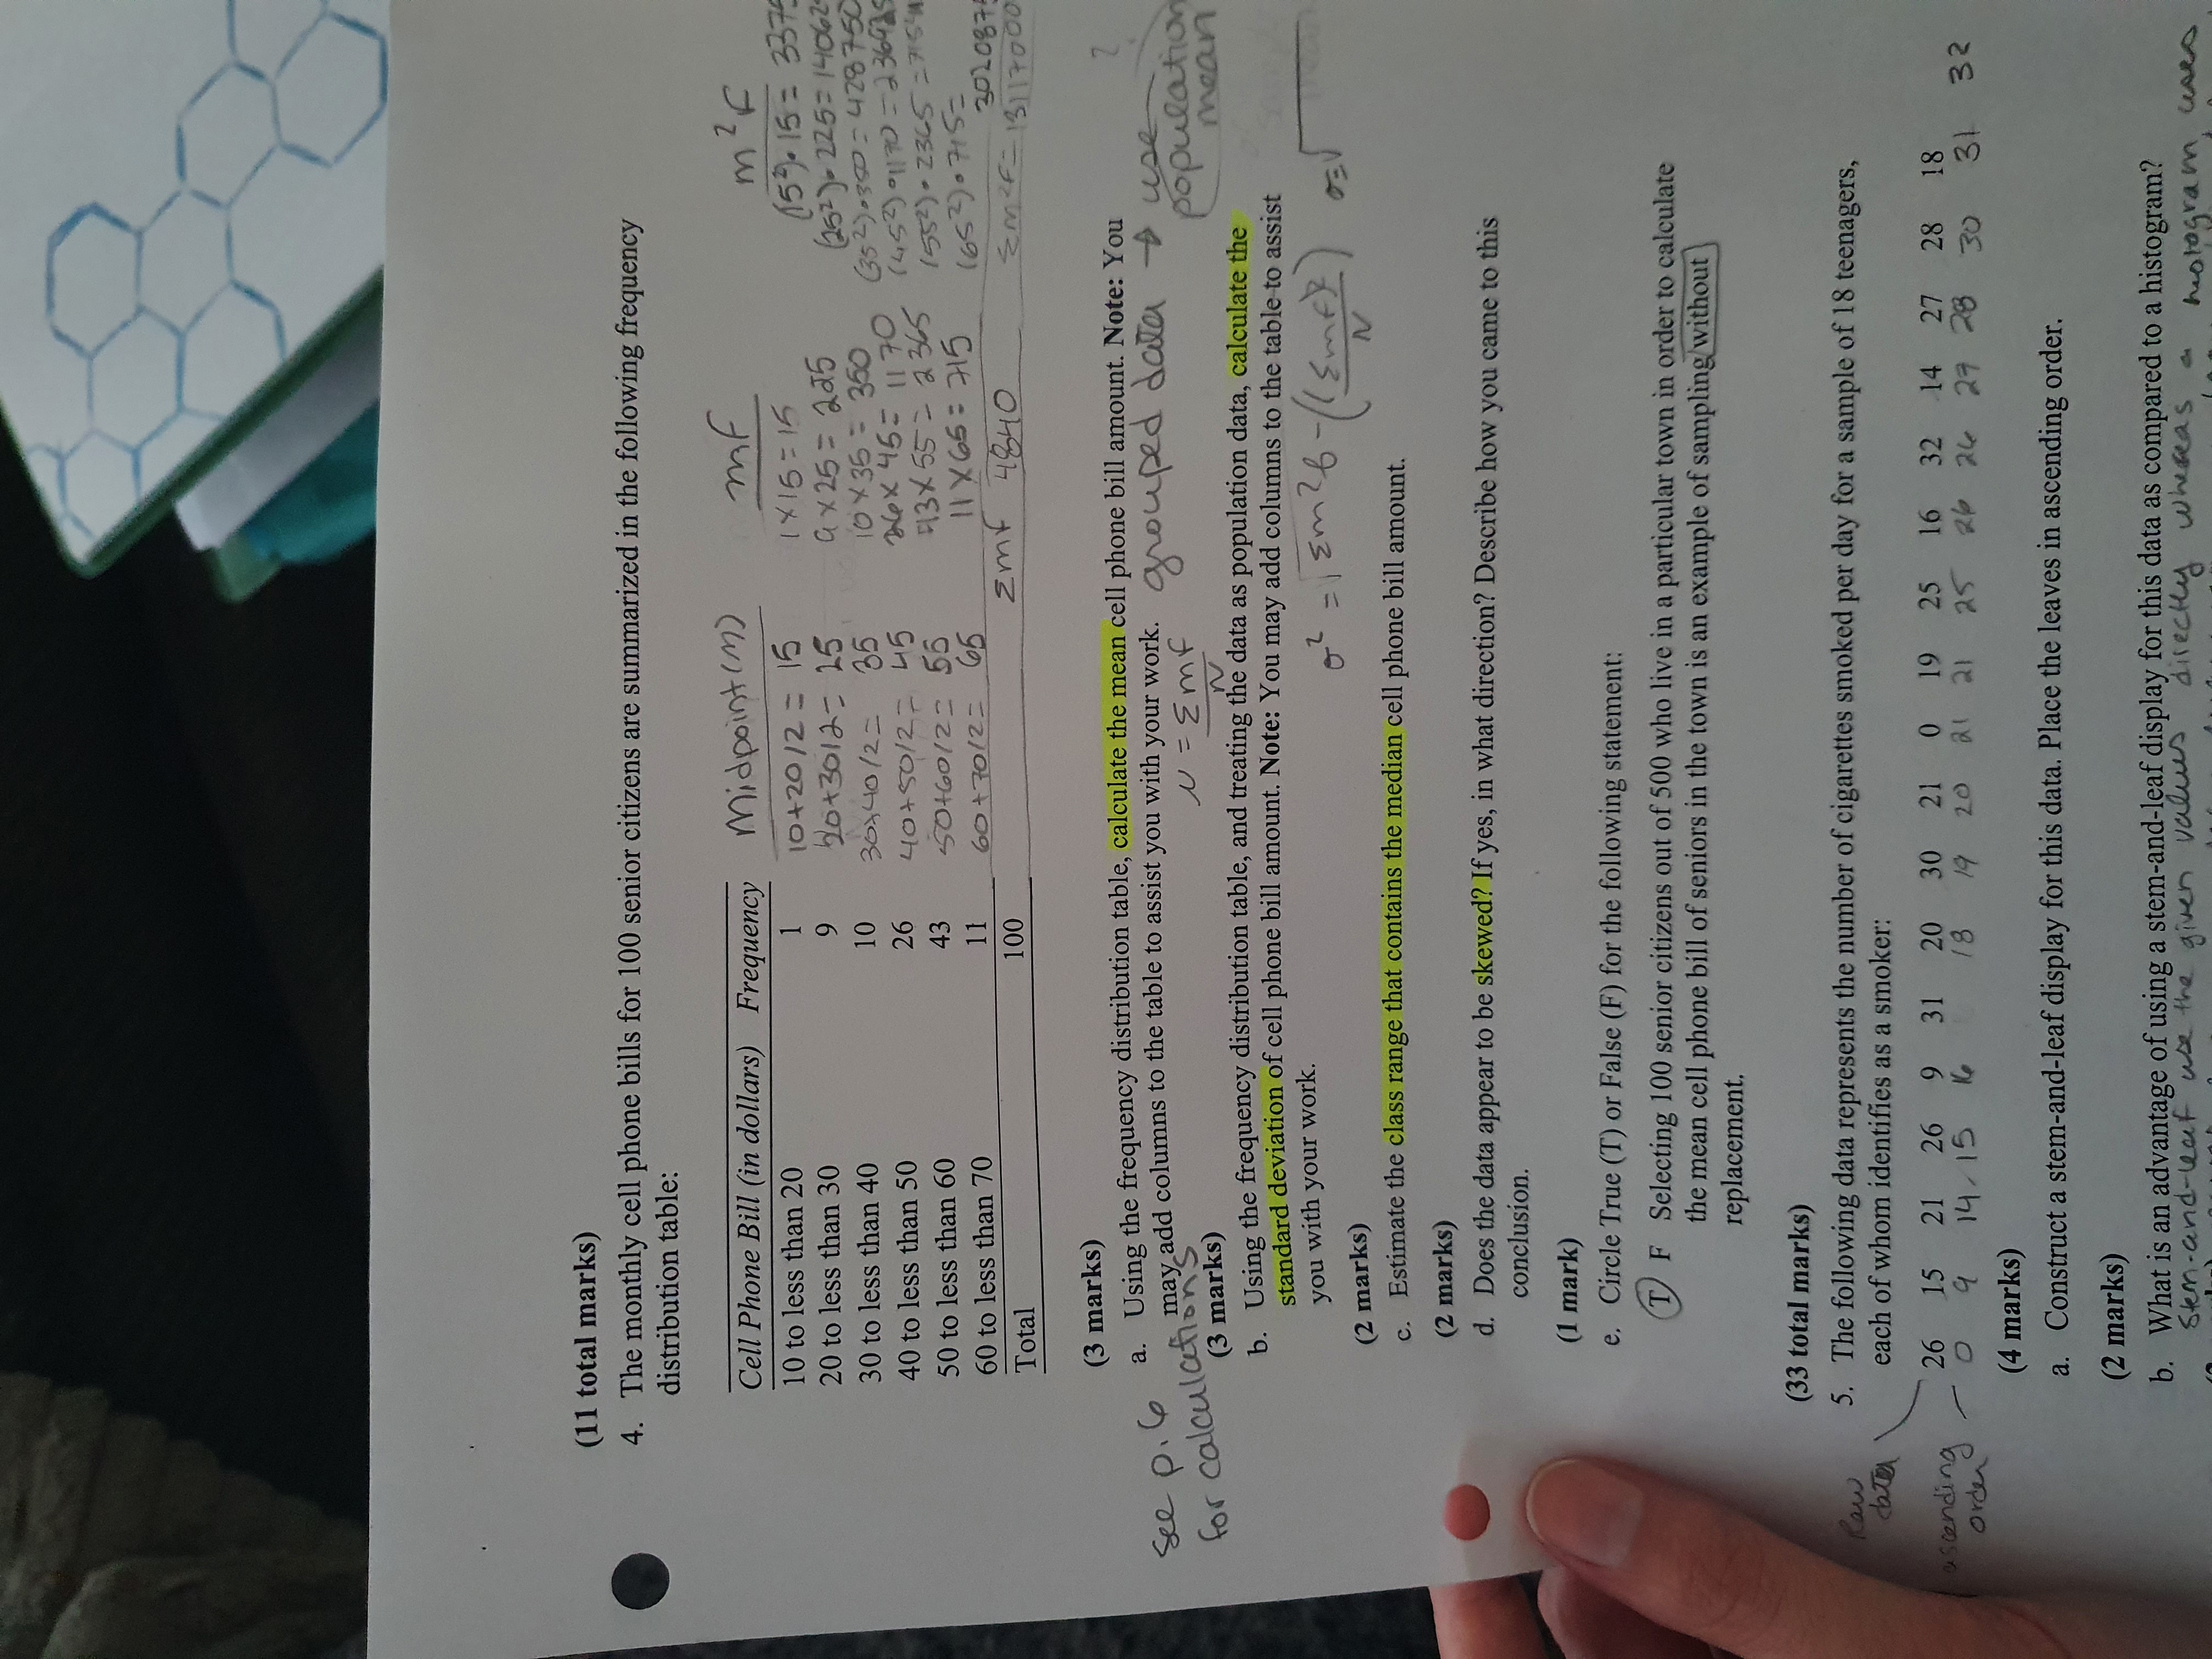
In QUESTION 4 C, how can i "estimate the class range that contains a median from the values"? I thought those were two different equations.
IE Range = largest value - smallest value
Median= Middle value when data is written out from smallest to largest value.
Thanks,
Baillie
(11 total marks) 4. The monthly cell phone bills for 100 senior citizens are summarized in the following frequency distribution table: Cell Phone Bill (in dollars) Frequency midpoint (m) mf 10 to less than 20 20 to less than 30 10+20/2 = 15 1X16= 15 30 to less than 40 20+ 3012 = 25 G x 25 = 285 159 . 15 = 337 ( 252)- 225=14062 30+ 40 / 2 = 35 10 * 35 = 2 40 to less than 50 (35 2) 0350- 428 750 26 40+50 /2 - 45 24x 45= 1170 $3X 55 = 2365 (452) -1170= 236925 50 to less than 60 43 50+60/2- 55 1552)- 2365 =7154 60 to less than 70 11 60+ 70/ 2 = 65 11X65: 715 (65 3).715 = Total 100 Emx 4840 302087 Em 2F = 13117000 (3 marks) See p. 6 a. Using the frequency distribution table, calculate the mean cell phone bill amount. Note: You for calculations may add columns to the table to assist you with your work. (3 marks) N = Emf grouped data to use population b. Using the frequency distribution table, and treating the data as population data, calculate the mean standard deviation of cell phone bill amount. Note: You may add columns to the table to assist you with your work. (2 marks) 02 = 1Em 26-/18 mex ) c. Estimate the class range that contains the median cell phone bill amount. N (2 marks) d. Does the data appear to be skewed? If yes, in what direction? Describe how you came to this conclusion. (1 mark) e, Circle True (T) or False (F) for the following statement: T F Selecting 100 senior citizens out of 500 who live in a particular town in order to calculate the mean cell phone bill of seniors in the town is an example of sampling without replacement. (33 total marks) law 5. The following data represents the number of cigarettes smoked per day for a sample of 18 teenagers, each of whom identifies as a smoker: ascending 26 15 21 26 14 -15 31 20 18 30 21 order 19 20 0 19 21 21 25 16 25 32 14 27 28 28 18 32 (4 marks) 26 24 27 30 31 a. Construct a stem-and-leaf display for this data. Place the leaves in ascending order. (2 marks) b. What is an advantage of using a stem-and-leaf display for this data as compared to a histogram? Stem- and-leaf use the given values directly whereas hologram