 Hello, please help. Needing help with number 4. I will vote accordingly. Thank you in advance.
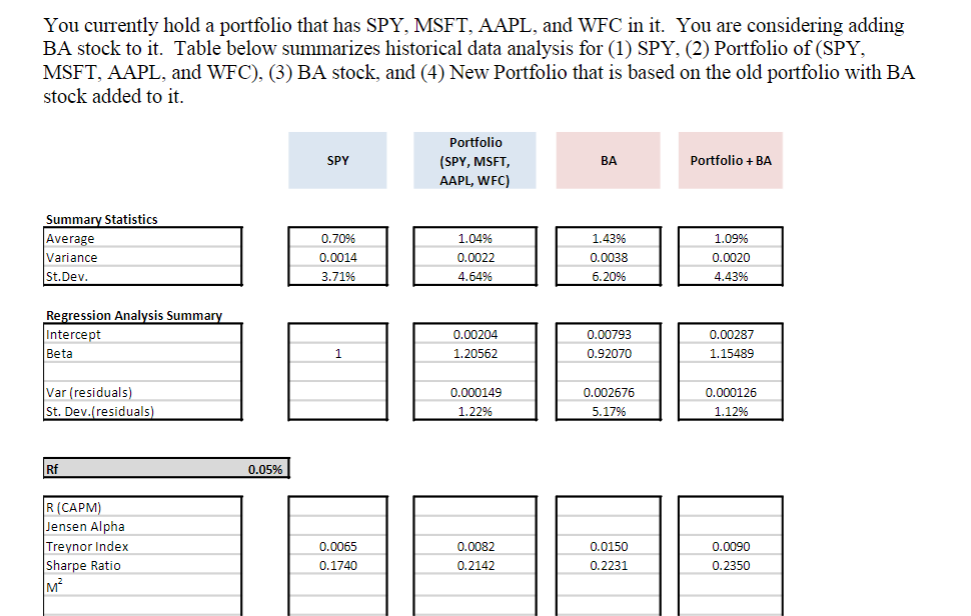
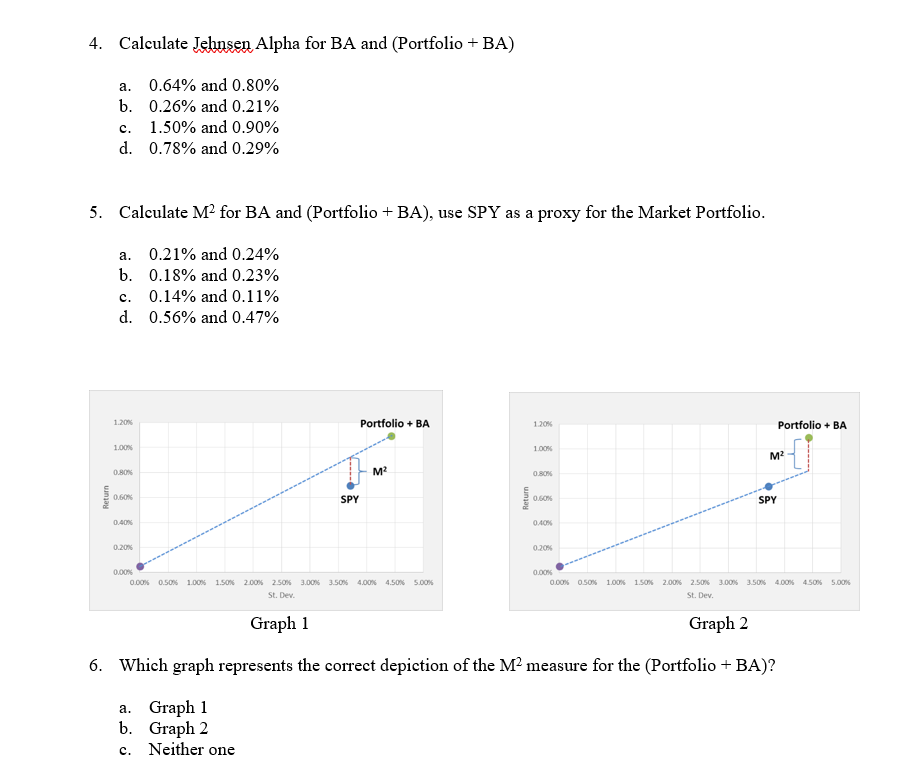
You currently hold a portfolio that has SPY, MSFT, AAPL, and WFC in it. You are considering adding BA stock to it. Table below summarizes historical data analysis for (1) SPY, (2) Portfolio of (SPY, MSFT, AAPL, and WFC), (3) BA stock, and (4) New Portfolio that is based on the old portfolio with BA stock added to it. SPY Portfolio (SPY, MSFT, AAPL, WFC) BA Portfolio + BA Summary Statistics Average Variance St.Dev. 0.7096 0.0014 3.71% 1.0496 0.0022 4.6496 1.4396 0.0038 6.2096 1.09% 0.0020 4.4396 Regression Analysis Summary Intercept Beta 0.00204 1.20562 0.00793 0.92070 0.00287 1.15489 1 Var (residuals) St. Dev. residuals) 0.000149 1.22% 0.002676 5.17% 0.000126 1.129 Rf 0.05% R (CAPM) Jensen Alpha Treynor Index Sharpe Ratio M 0.0065 0.1740 0.0082 0.2142 0.0150 0.2231 0.0090 0.2350 4. Calculate Lehnsen Alpha for BA and (Portfolio + BA) a. 0.64% and 0.80% b. 0.26% and 0.21% 1.50% and 0.90% d. 0.78% and 0.29% c. 5. Calculate M2 for BA and (Portfolio + BA), use SPY as a proxy for the Market Portfolio. a. 0.21% and 0.24% b. 0.18% and 0.23% 0.14% and 0.11% d. 0.56% and 0.47% c. 1.20 Portfolio + BA 1.20% Portfolio + BA 1.00% 1.00 M2 0.80% M2 0.80% Return 0.60% SPY Return 0.60% SPY 0.40% 0.40% 0.20% 0.20% 0.00% 0.00% 0.50% 1.00% 1.50% 2.00% 2.50% 3.00% 3.50% 4.00% 4.50% 5.00% St. Dev. 0.00% 0.00% 0.50% 1.00% 1.50% 2.00% 2.50 3.00% 3.50% 4.00% 4.50% 5.00% St. Dev. Graph 1 Graph 2 6. Which graph represents the correct depiction of the M2 measure for the (Portfolio + BA)? a. Graph 1 b. Graph 2 Neither one c. You currently hold a portfolio that has SPY, MSFT, AAPL, and WFC in it. You are considering adding BA stock to it. Table below summarizes historical data analysis for (1) SPY, (2) Portfolio of (SPY, MSFT, AAPL, and WFC), (3) BA stock, and (4) New Portfolio that is based on the old portfolio with BA stock added to it. SPY Portfolio (SPY, MSFT, AAPL, WFC) BA Portfolio + BA Summary Statistics Average Variance St.Dev. 0.7096 0.0014 3.71% 1.0496 0.0022 4.6496 1.4396 0.0038 6.2096 1.09% 0.0020 4.4396 Regression Analysis Summary Intercept Beta 0.00204 1.20562 0.00793 0.92070 0.00287 1.15489 1 Var (residuals) St. Dev. residuals) 0.000149 1.22% 0.002676 5.17% 0.000126 1.129 Rf 0.05% R (CAPM) Jensen Alpha Treynor Index Sharpe Ratio M 0.0065 0.1740 0.0082 0.2142 0.0150 0.2231 0.0090 0.2350 4. Calculate Lehnsen Alpha for BA and (Portfolio + BA) a. 0.64% and 0.80% b. 0.26% and 0.21% 1.50% and 0.90% d. 0.78% and 0.29% c. 5. Calculate M2 for BA and (Portfolio + BA), use SPY as a proxy for the Market Portfolio. a. 0.21% and 0.24% b. 0.18% and 0.23% 0.14% and 0.11% d. 0.56% and 0.47% c. 1.20 Portfolio + BA 1.20% Portfolio + BA 1.00% 1.00 M2 0.80% M2 0.80% Return 0.60% SPY Return 0.60% SPY 0.40% 0.40% 0.20% 0.20% 0.00% 0.00% 0.50% 1.00% 1.50% 2.00% 2.50% 3.00% 3.50% 4.00% 4.50% 5.00% St. Dev. 0.00% 0.00% 0.50% 1.00% 1.50% 2.00% 2.50 3.00% 3.50% 4.00% 4.50% 5.00% St. Dev. Graph 1 Graph 2 6. Which graph represents the correct depiction of the M2 measure for the (Portfolio + BA)? a. Graph 1 b. Graph 2 Neither one c