Answered step by step
Verified Expert Solution
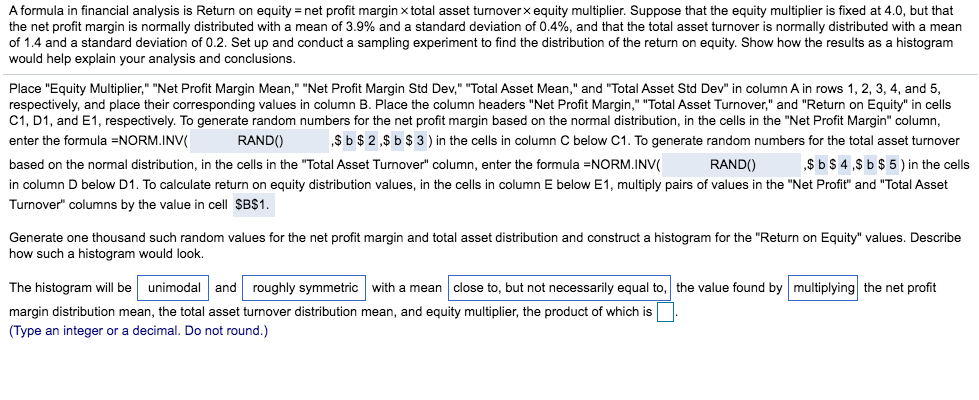
Link Copied!

Question

1 Approved Answer

Hello, Please, I almost finished this problem, but I need help at the bottom, please. The last box I need help with. A formula in

Hello, Please, I almost finished this problem, but I need help at the bottom, please. The last box I need help with.

image text in transcribed
A formula in financial analysis is Return on equity = net profit margin x total asset turnover x equity multiplier. Suppose that the equity multiplier is fixed at 4.0, but that the net profit margin is normally distributed with a mean of 3.9% and a standard deviation of 0.4%, and that the total asset turnover is normally distributed with a mean of 1.4 and a standard deviation of 0.2. Set up and conduct a sampling experiment to find the distribution of the return on equity. Show how the results as a histogram would help explain your analysis and conclusions. Place "Equity Multiplier," "Net Profit Margin Mean," "Net Profit Margin Std Dev," "Total Asset Mean," and "Total Asset Std Dev" in column A in rows 1, 2, 3, 4, and 5, respectively, and place their corresponding values in column B. Place the column headers "Net Profit Margin," "Total Asset Turnover," and "Return on Equity" in cells C1, D1, and E1, respectively. To generate random numbers for the net profit margin based on the normal distribution, in the cells in the "Net Profit Margin" column, enter the formula =NORM.INV( RANDO) ,$ b $ 2 ,$ b $ 3 ) in the cells in column C below C1. To generate random numbers for the total asset turnover based on the normal distribution, in the cells in the "Total Asset Turnover" column, enter the formula =NORM.INV( RANDO) ,$ b $ 4 ,$ b $ 5 ) in the cells in column D below D1. To calculate return on equity distribution values, in the cells in column E below E1, multiply pairs of values in the "Net Profit" and "Total Asset Turnover" columns by the value in cell SB$1. Generate one thousand such random values for the net profit margin and total asset distribution and construct a histogram for the "Return on Equity" values. Describe how such a histogram would look. The histogram will be unimodal and roughly symmetric with a mean | close to, but not necessarily equal to, the value found by| multiplying the net profit margin distribution mean, the total asset turnover distribution mean, and equity multiplier, the product of which is (Type an integer or a decimal. Do not round.)

Step by Step Solution

There are 3 Steps involved in it

Step: 1

blur-text-image

Get Instant Access to Expert-Tailored Solutions

See step-by-step solutions with expert insights and AI powered tools for academic success

Step: 2

blur-text-image

Step: 3

blur-text-image

Ace Your Homework with AI

Get the answers you need in no time with our AI-driven, step-by-step assistance

Get Started

Recommended Textbook for

Mathematics for Economics and Business

Authors: Ian Jacques

9th edition

129219166X, 9781292191706 , 978-1292191669

More Books

Students also viewed these Mathematics questions