Hello! So I'm currently making and using a Monte Carlo Simulation in excel to calculate the probability an individuals savings will last beyond his 85th birthday (which is on December 31st). I've made the simulation, but struggling on how to approach the questions.
Is I'm not being clear enough or you need more information to point me in the right direction please let me know! I guess what I'm really wondering is what equation do I use on excel. Thank you in advance!
Here's the link to the excel spreadsheet on google.dox.
https://docs.google.com/spreadsheets/d/1MOF1BCGw-CFXuEuDBySGFbCoPTqMc8Lm649PO6Nk-_o/edit?usp=sharing
And the questions I need to answer.
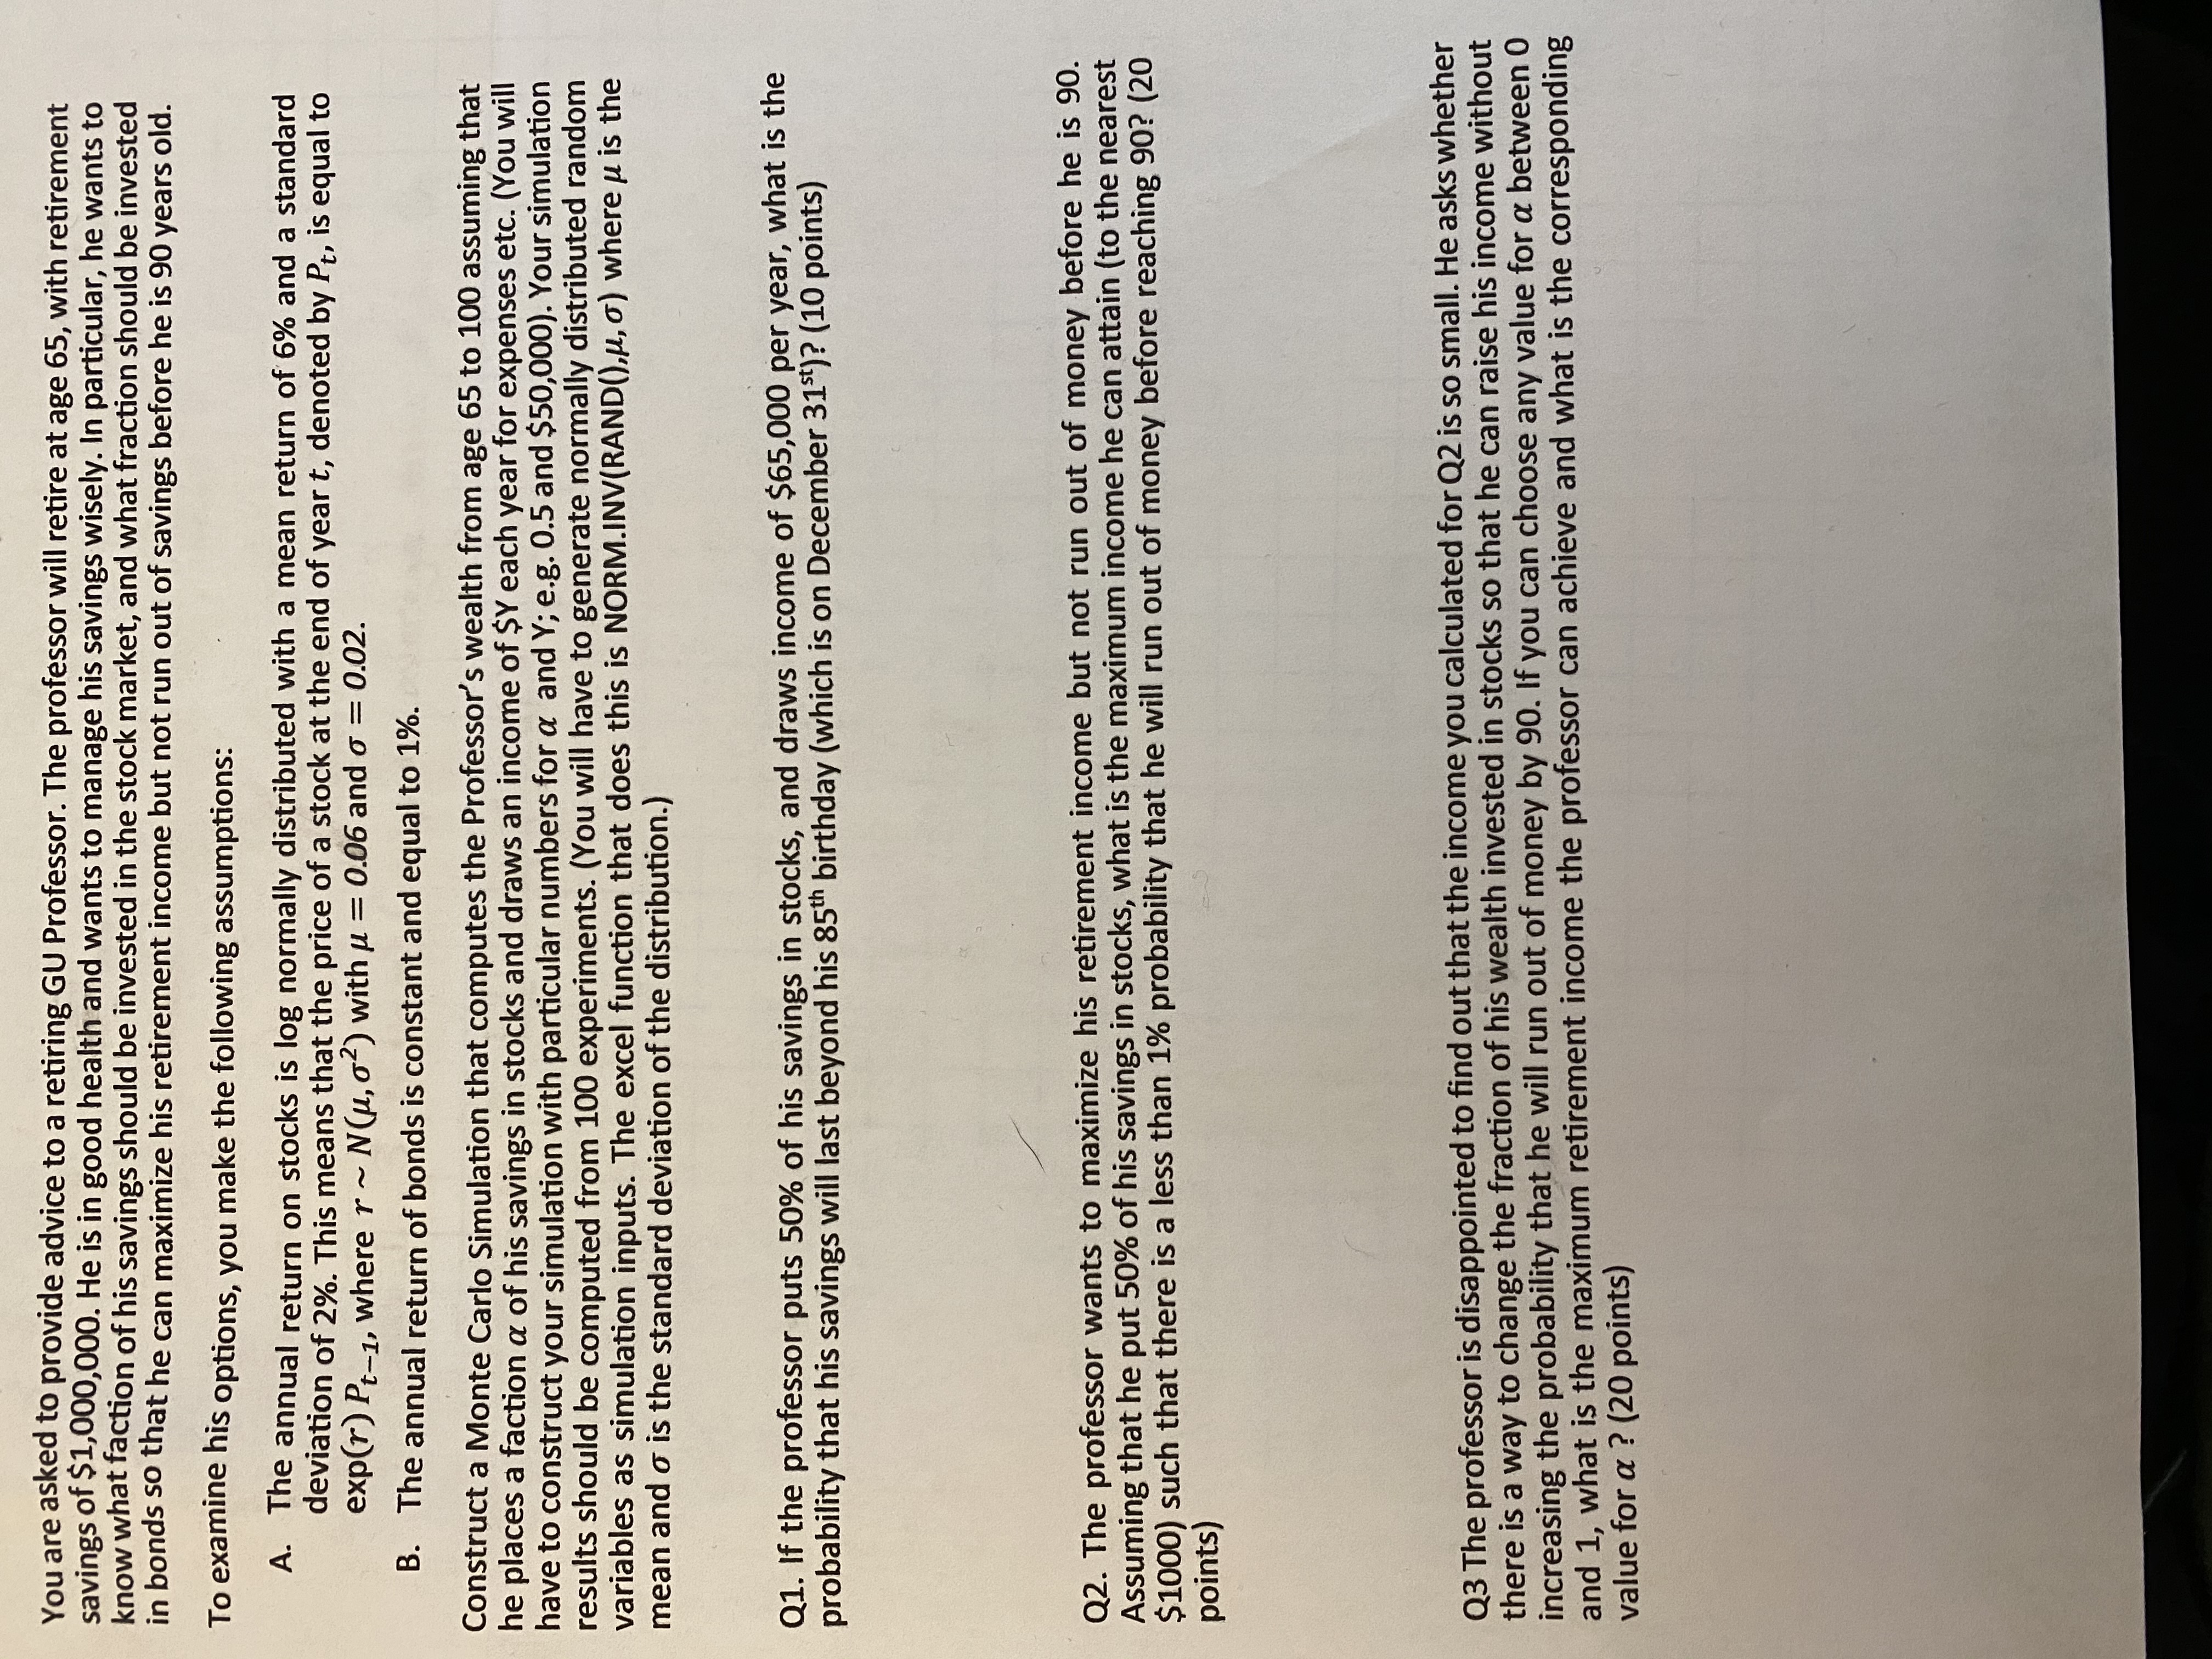
You are asked to provide advice to a retiring GU Professor. The professor will retire at age 65, with retirement savings of $1,000,000. He is in good health and wants to manage his savings wisely. In particular, he wants to know what faction of his savings should be invested in the stock market, and what fraction should be invested in bonds so that he can maximize his retirement income but not run out of savings before he is 90 years old. To examine his options, you make the following assumptions: A. The annual return on stocks is log normally distributed with a mean return of 6% and a standard deviation of 2%. This means that the price of a stock at the end of year t, denoted by Pt, is equal to exp(r) Pt-1, where r ~ N(u, o') with u = 0.06 and o = 0.02. B. The annual return of bonds is constant and equal to 1%. Construct a Monte Carlo Simulation that computes the Professor's wealth from age 65 to 100 assuming that he places a faction a of his savings in stocks and draws an income of SY each year for expenses etc. (You will have to construct your simulation with particular numbers for a and Y; e.g. 0.5 and $50,000). Your simulation results should be computed from 100 experiments. (You will have to generate normally distributed random variables as simulation inputs. The excel function that does this is NORM.INV(RAND(),u, ) where u is the mean and o is the standard deviation of the distribution.) Q1. If the professor puts 50% of his savings in stocks, and draws income of $65,000 per year, what is the probability that his savings will last beyond his 85th birthday (which is on December 31st)? (10 points) Q2. The professor wants to maximize his retirement income but not run out of money before he is 90. Assuming that he put 50% of his savings in stocks, what is the maximum income he can attain (to the nearest $1000) such that there is a less than 1% probability that he will run out of money before reaching 90? (20 points) Q3 The professor is disappointed to find out that the income you calculated for Q2 is so small. He asks whether there is a way to change the fraction of his wealth invested in stocks so that he can raise his income without increasing the probability that he will run out of money by 90. If you can choose any value for a between 0 and 1, what is the maximum retirement income the professor can achieve and what is the corresponding value for a ? (20 points)


