Question
Hello, TEAM! The goal is to reduce waiting time in hospital appointments. The upper control limit or goal is 40 minutes (.67 decimal hours). 1)Please
Hello, TEAM!
The goal is to reduce waiting time in hospital appointments.
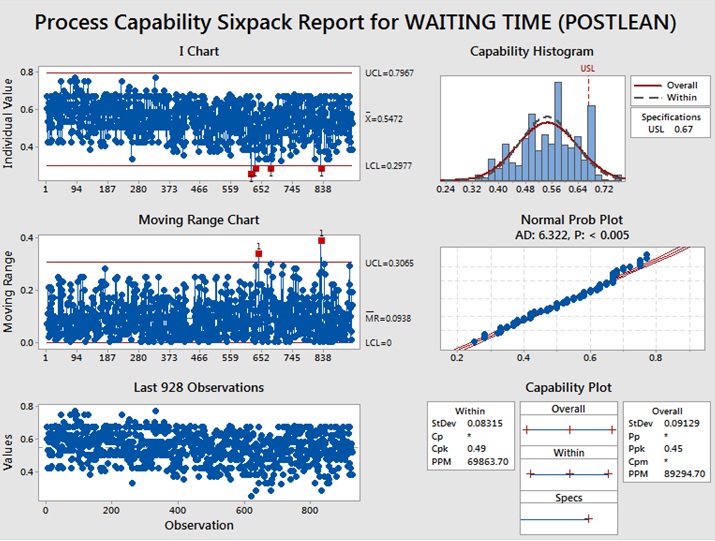
The upper control limit or goal is 40 minutes (.67 decimal hours).
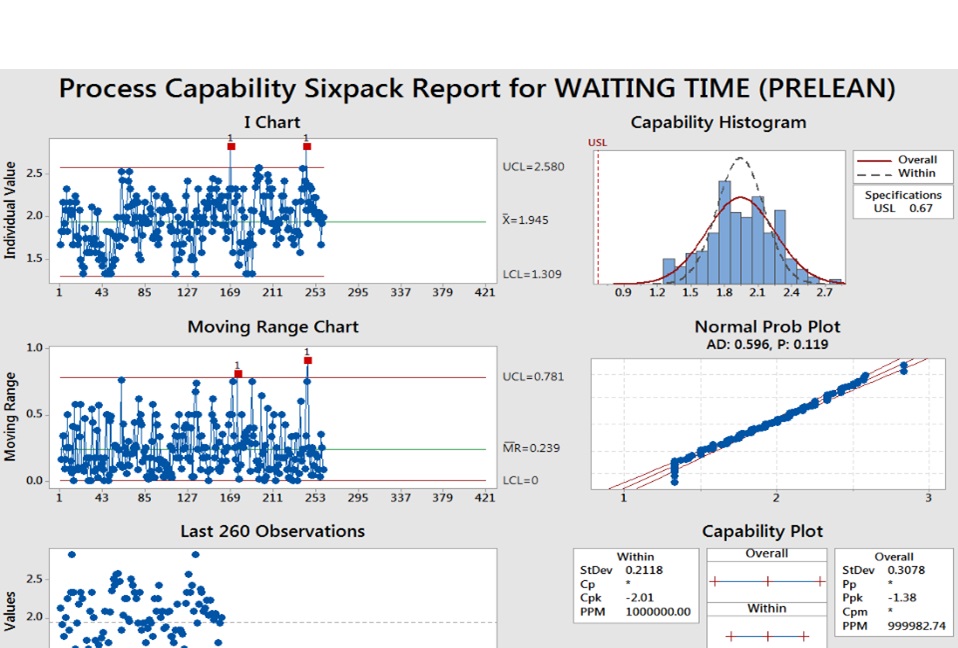
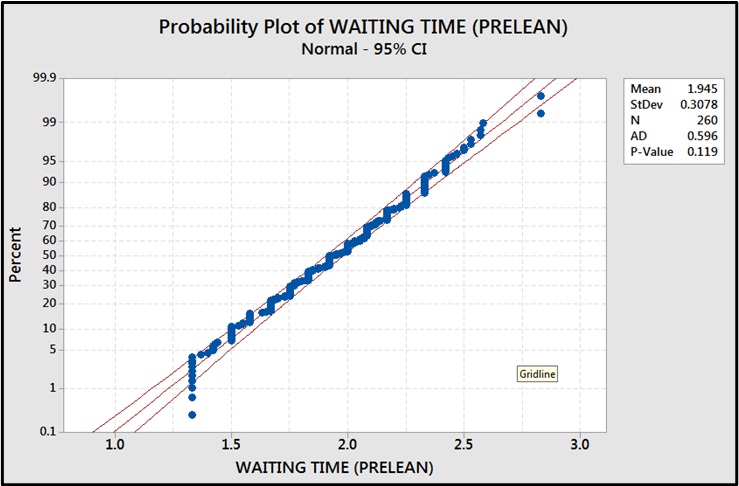
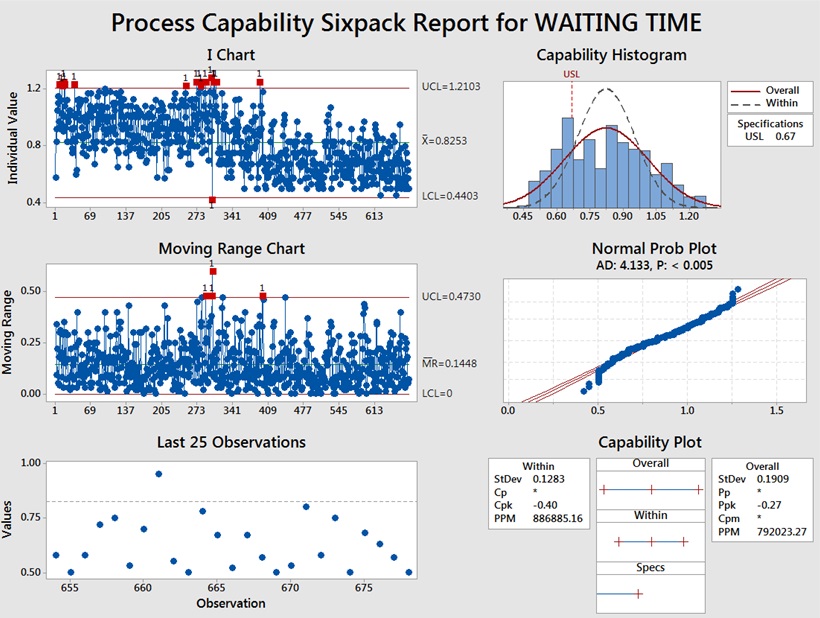
1)Please interpret both PRE-LEAN AND POST-LEAN CHARTS.Please compare and contrast these probability plots.
2)Does the PRE-LEAN PROBABILITY PLOT SHOW NORMALITY?DOES IT HAVE A NORMAL DISTRIBUTION?If yes, please explain why?If the answer is no, please also give your explanation.
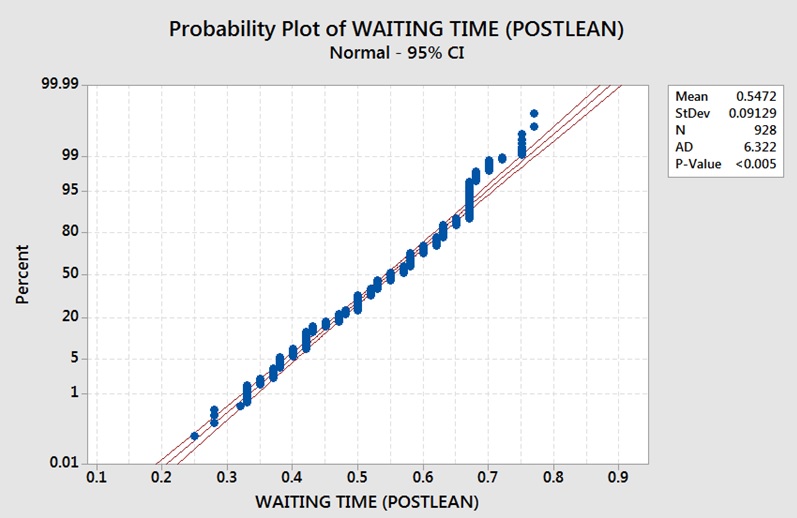
3)Does the POST-LEAN PROBABILITY PLOT SHOW NORMALITY?DOES IT HAVE A NORMAL DISTRIBUTION?If yes, please explain why?If the answer is no, please also give your explanation.
In MY HUMBLE OPINION - The POS-LEAN PROBABILITY chart shows a slight departure from normality, but not to an effect that would significantly affect the Ppk analysis because the majority of points fall within the confidence lines.BUT I AM NOT SURE ABOUT THIS.WOULD IT SAFE TO ASSUME THIS ANSWER OR CONCLUSION?
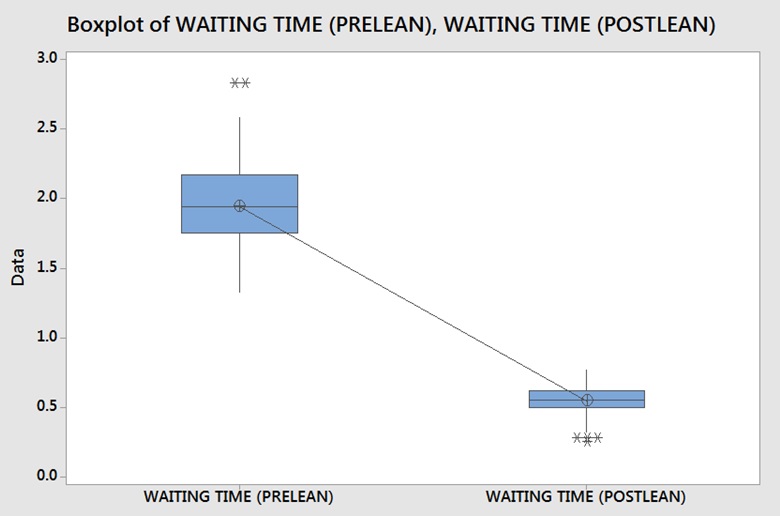
4)WHICH PROBABILITY PLOT/CHART IS BETTER AND SHOWS IMPROVEMENT?THE PRE-LEAN OR POST-LEAN? EXPLAIN WHY.ARE THEY STATISTICALLY SIGNIFICANT?EXPLAIN WHY.ALSO STATE YOUR CONCLUSIONS.
5)IF POSTLEAN DOES NOT SHOW NORMALITY, HOW CAN THIS BE FIXED?HOW CAN WE SHOW NORMALITY?
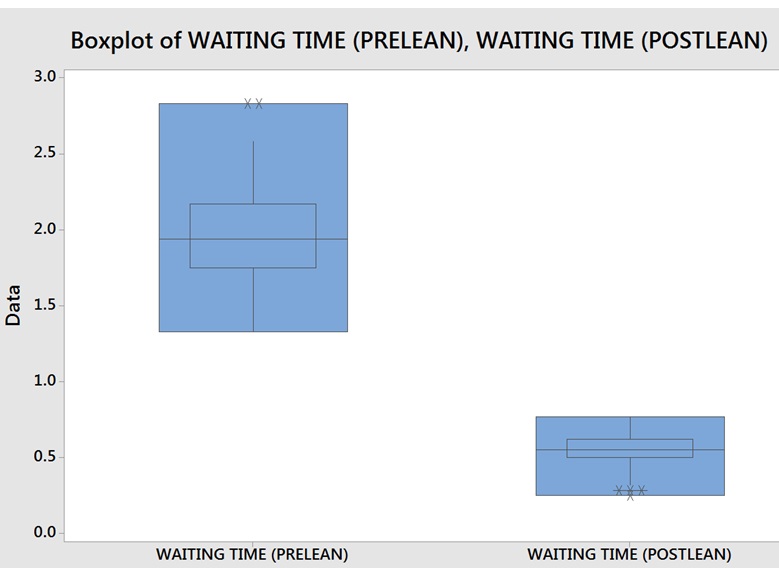
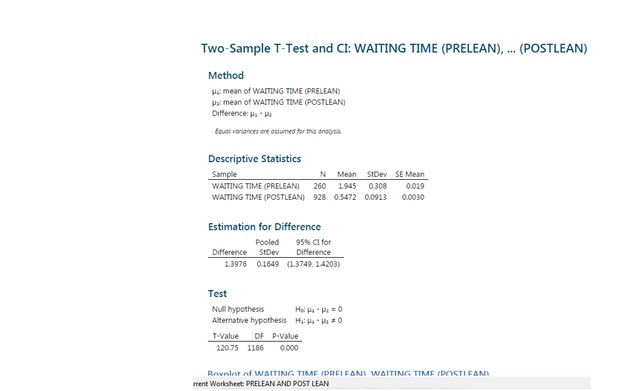
6)Based on the attached charts, do you recommend a two-sample t-test (parametric)? if yes, why? I would like to use two-sample t-test, but I am not sure if this would be correct to use?Would it be appropriate to use the two-sample t-test?I went ahead and used it anyway.The box plot and output are attached.
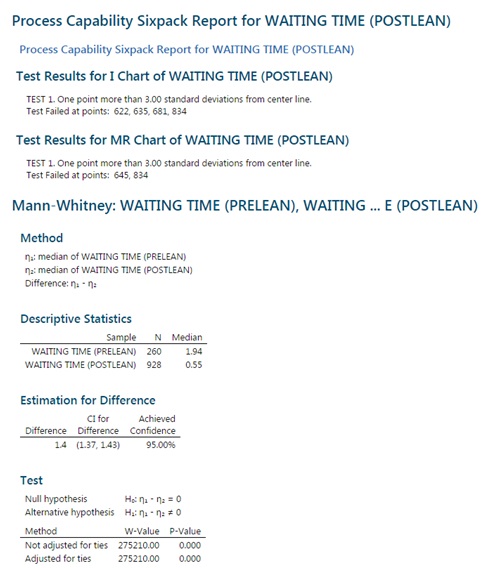
7)Or do you recommend a Mann-Whitney (non-parametric) test?
Just for the sake of argument, I went ahead and did a Mann-Whitney Test.The Mann-Whitney box plot and output charts are attached.Is that better?What are your conclusions?
8)Can we use both two-sample t-test and Mann-Whitney?Why or Why not?
9)Which shows better improvement in waiting time?The PRE-LEAN? OR POST-LEAN?PLEASE state your reason and conclusion.
10)PLEASE INTERPRET THE MINITAB CAPABILITY 6 PACK CHARTS AND COMPARE/CONTRAST THEM - 1) PRE LEAN CHART, 2) TRANSITION CHART, AND 3) POST LEAN CHART.
11)ONCE AGAIN TAKE NOTE:The goal is to reduce waiting time in hospital appointments.The upper control limit or goal is 40 minutes (.67 decimal hours).WHICH CHART SHOWS THE MOST IMPROVEMENT IN WAITING TIME?
PLEASE NOTE:I already attached the TOTAL 9 charts......it is in jpeg format.Please find them attached.It may take a while to upload due to the size.
PLEASE EXPEDITE.THANK YOU FOR YOUR 100 % SUPPORT!
COURSE HERO IS THE BEST!!
Step by Step Solution
There are 3 Steps involved in it
Step: 1

Get Instant Access to Expert-Tailored Solutions
See step-by-step solutions with expert insights and AI powered tools for academic success
Step: 2

Step: 3

Ace Your Homework with AI
Get the answers you need in no time with our AI-driven, step-by-step assistance
Get Started


