Question
Hello there. I was hoping to have some help with this particular problem because I am currently missing key information or just not setting up


Hello there. I was hoping to have some help with this particular problem because I am currently missing key information or just not setting up the correct values. After all, they seem to be very low compared to the above-mentioned problem. I would appreciate any assistance on how I can correctly format and answer this question with MATLAB, and how to ensure my model looks and functions normally. I have the provided problem 1 (a) solution in MATLAB and will list it below for further context information. I appreciate your assistance and look forward to your thoughts on this particular problem. Thank you for your time.
Z_theta = 98888;
m = 9199423641;
a = 75073001;
c = 75668;
n = 5000; % Number of random numbers to generate
% Initialize the seed
seed = Z_theta;
% Initialize arrays to store generated random numbers
random_numbers = zeros(1, n);
% Generate random numbers
for i = 1:n
seed = mod(a * seed + c, m);
random_numbers(i) = seed / m;
end
% Display the first 15 and last 15 generated random numbers
disp('First 15 random numbers:');
disp(random_numbers(1:15));
disp('Last 15 random numbers:');
disp(random_numbers(end-14:end));
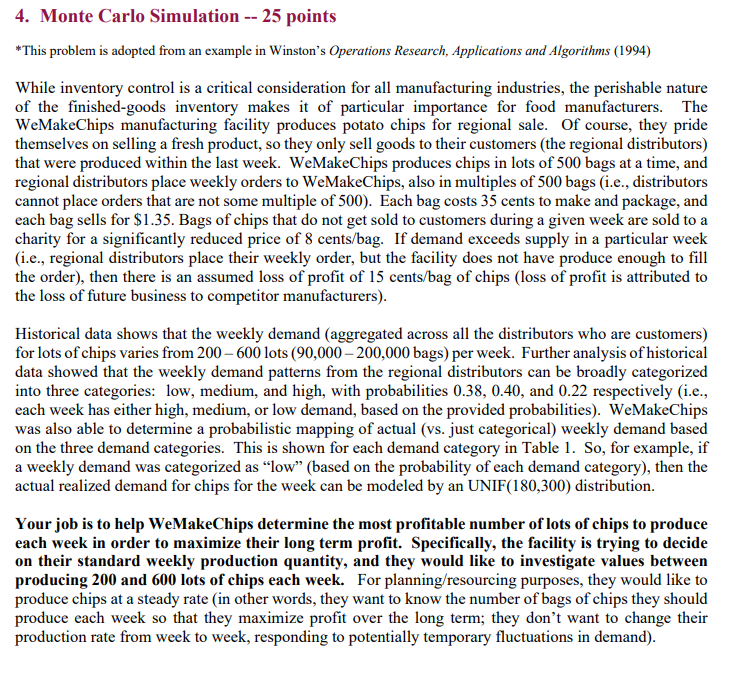
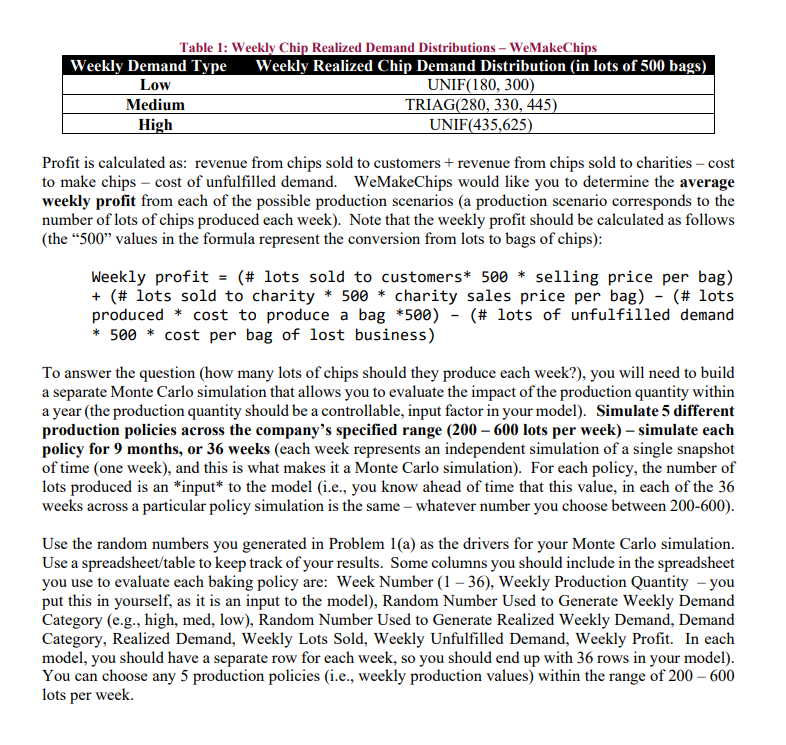
*This problem is adopted from an example in Winston's Operations Research, Applications and Algorithms (1994) While inventory control is a critical consideration for all manufacturing industries, the perishable nature of the finished-goods inventory makes it of particular importance for food manufacturers. The WeMakeChips manufacturing facility produces potato chips for regional sale. Of course, they pride themselves on selling a fresh product, so they only sell goods to their customers (the regional distributors) that were produced within the last week. WeMakeChips produces chips in lots of 500 bags at a time, and regional distributors place weekly orders to WeMakeChips, also in multiples of 500 bags (i.e., distributors cannot place orders that are not some multiple of 500). Each bag costs 35 cents to make and package, and each bag sells for $1.35. Bags of chips that do not get sold to customers during a given week are sold to a charity for a significantly reduced price of 8cents/bag. If demand exceeds supply in a particular week (i.e., regional distributors place their weekly order, but the facility does not have produce enough to fill the order), then there is an assumed loss of profit of 15 cents/bag of chips (loss of profit is attributed to the loss of future business to competitor manufacturers). Historical data shows that the weekly demand (aggregated across all the distributors who are customers) for lots of chips varies from 200600 lots (90,000200,000 bags ) per week. Further analysis of historical data showed that the weekly demand patterns from the regional distributors can be broadly categorized into three categories: low, medium, and high, with probabilities 0.38,0.40, and 0.22 respectively (i.e., each week has either high, medium, or low demand, based on the provided probabilities). WeMakeChips was also able to determine a probabilistic mapping of actual (vs. just categorical) weekly demand based on the three demand categories. This is shown for each demand category in Table 1. So, for example, if a weekly demand was categorized as "low" (based on the probability of each demand category), then the actual realized demand for chips for the week can be modeled by an UNIF(180,300) distribution. Your job is to help WeMakeChips determine the most profitable number of lots of chips to produce each week in order to maximize their long term profit. Specifically, the facility is trying to decide on their standard weekly production quantity, and they would like to investigate values between producing 200 and 600 lots of chips each week. For planning/resourcing purposes, they would like to produce chips at a steady rate (in other words, they want to know the number of bags of chips they should produce each week so that they maximize profit over the long term; they don't want to change their production rate from week to week, responding to potentially temporary fluctuations in demand). Table 1: Weeklv Chin Realized Demand Distributions - WeMakeChins Profit is calculated as: revenue from chips sold to customers + revenue from chips sold to charities - cost to make chips - cost of unfulfilled demand. WeMakeChips would like you to determine the average weekly profit from each of the possible production scenarios (a production scenario corresponds to the number of lots of chips produced each week). Note that the weekly profit should be calculated as follows (the " 500 " values in the formula represent the conversion from lots to bags of chips): Weekly profit = (\# lots sold to customers*500* selling price per bag) +(# lots sold to charity 500 charity sales price per bag) - (\# lots produced * cost to produce a bag *500) - (\# lots of unfulfilled demand 500 cost per bag of lost business) Weekly profit =(# lots sold to customers*500* selling price per bag) + (\# lots sold to charity *500* charity sales price per bag) - (\# lots produced * cost to produce a bag *500) - (\# lots of unfulfilled demand * 500 cost per bag of lost business) To answer the question (how many lots of chips should they produce each week?), you will need to build a separate Monte Carlo simulation that allows you to evaluate the impact of the production quantity within a year (the production quantity should be a controllable, input factor in your model). Simulate 5 different production policies across the company's specified range (200 - 600 lots per week ) - simulate each policy for 9 months, or 36 weeks (each week represents an independent simulation of a single snapshot of time (one week), and this is what makes it a Monte Carlo simulation). For each policy, the number of lots produced is an *input* to the model (i.e., you know ahead of time that this value, in each of the 36 weeks across a particular policy simulation is the same - whatever number you choose between 200-600). Use the random numbers you generated in Problem 1(a) as the drivers for your Monte Carlo simulation. Use a spreadsheet/table to keep track of your results. Some columns you should include in the spreadsheet you use to evaluate each baking policy are: Week Number (136), Weekly Production Quantity - you put this in yourself, as it is an input to the model), Random Number Used to Generate Weekly Demand Category (e.g., high, med, low), Random Number Used to Generate Realized Weekly Demand, Demand Category, Realized Demand, Weekly Lots Sold, Weekly Unfulfilled Demand, Weekly Profit. In each model, you should have a separate row for each week, so you should end up with 36 rows in your model). You can choose any 5 production policies (i.e., weekly production values) within the range of 200600 lots per weekStep by Step Solution
There are 3 Steps involved in it
Step: 1

Get Instant Access to Expert-Tailored Solutions
See step-by-step solutions with expert insights and AI powered tools for academic success
Step: 2

Step: 3

Ace Your Homework with AI
Get the answers you need in no time with our AI-driven, step-by-step assistance
Get Started


