Answered step by step
Verified Expert Solution
Link Copied!

Question

1 Approved Answer

Hello! This is my practice exam for my Final exam of Statistics Class. I think that this does not goes against Course Hero's honor code

Hello! This is my practice exam for my Final exam of Statistics Class. I think that this does not goes against Course Hero's honor code because my Statistics professor gave this to us in order to practice for the final exam which is going to be about the same topics, however, different exercises and problems to solve. Therefore, I wanted a tutor's help to solve it. In order for me to practice since for this class we work in excell the most. My exam is going to be on May 6th, so I want to continue studying and do not fail this course. Thank you!
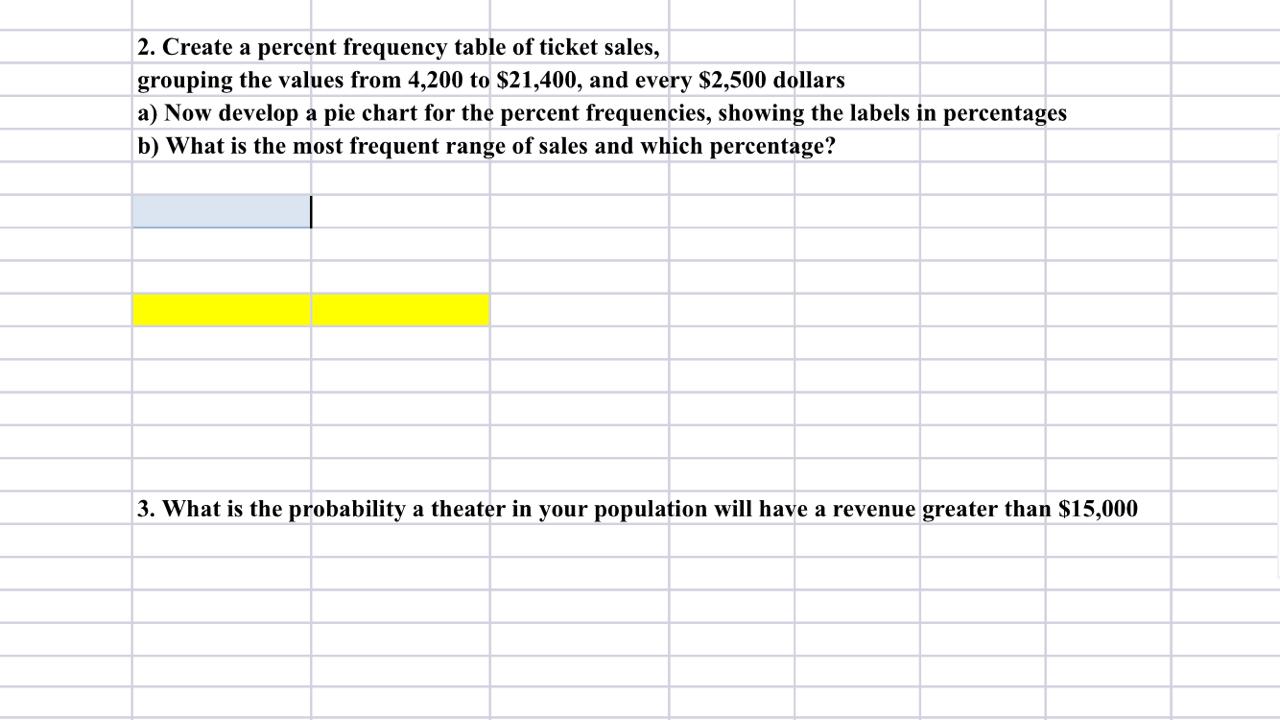
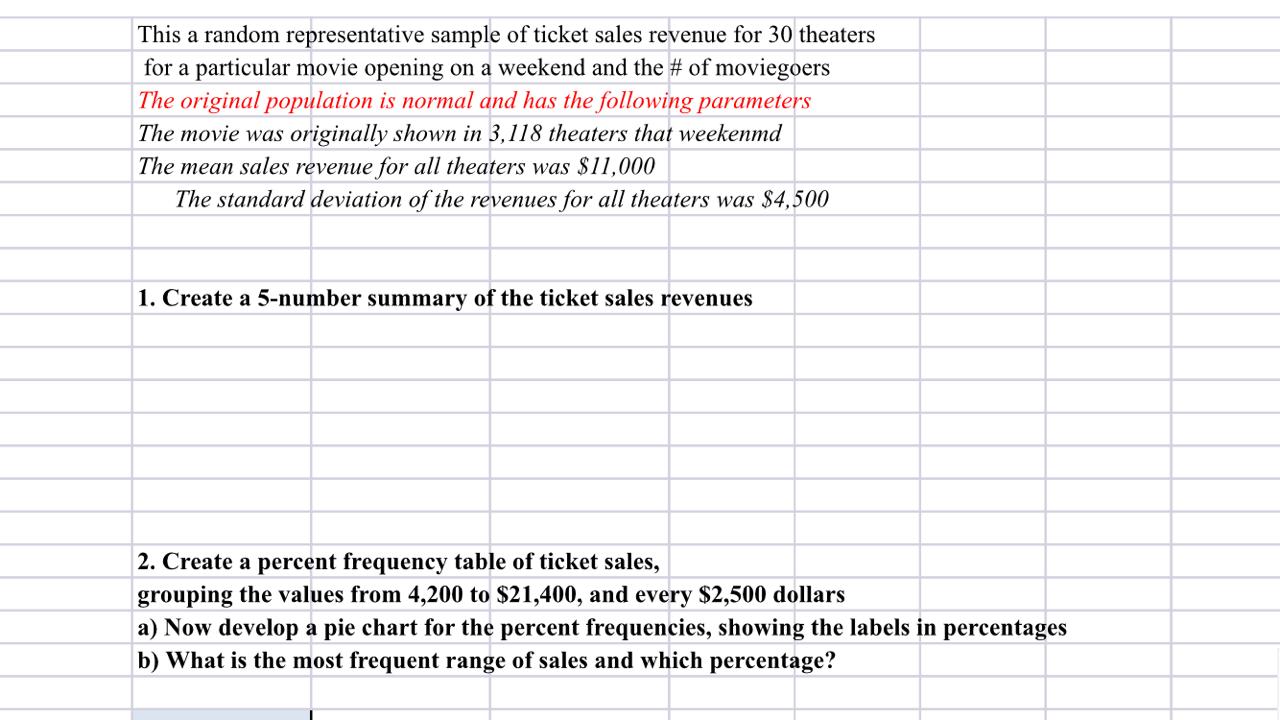
image text in transcribedimage text in transcribedimage text in transcribedimage text in transcribed
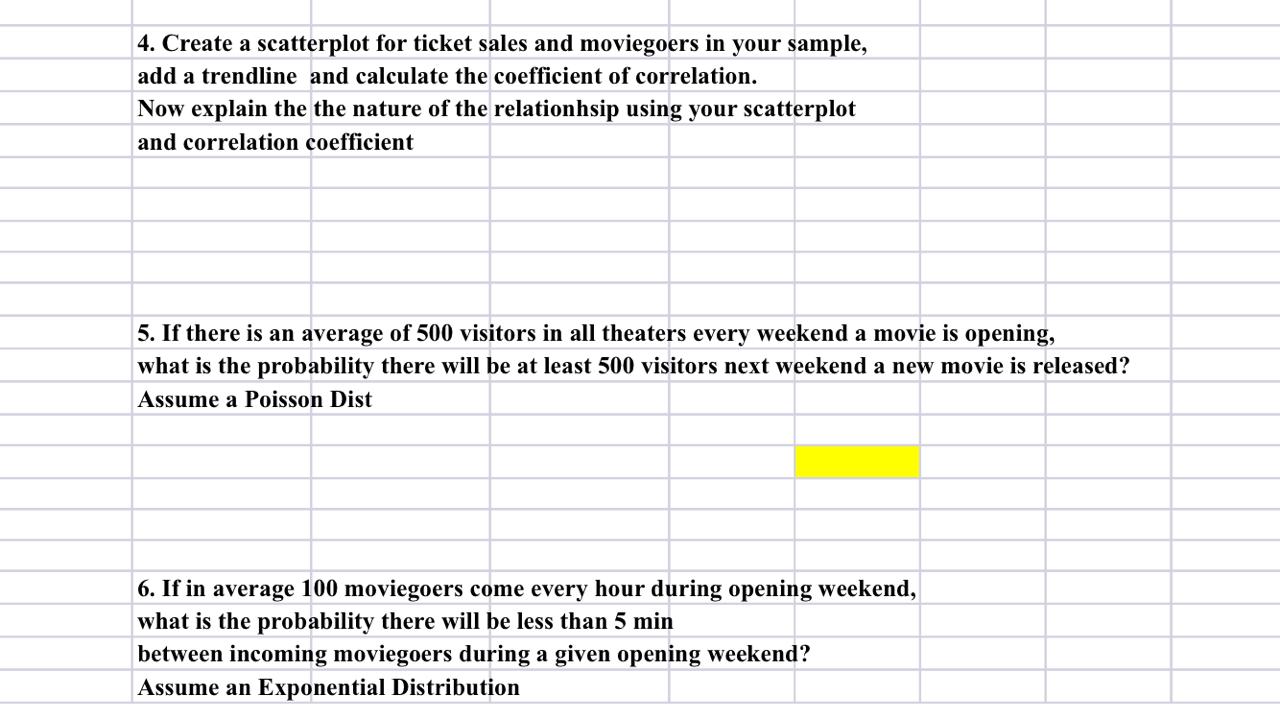
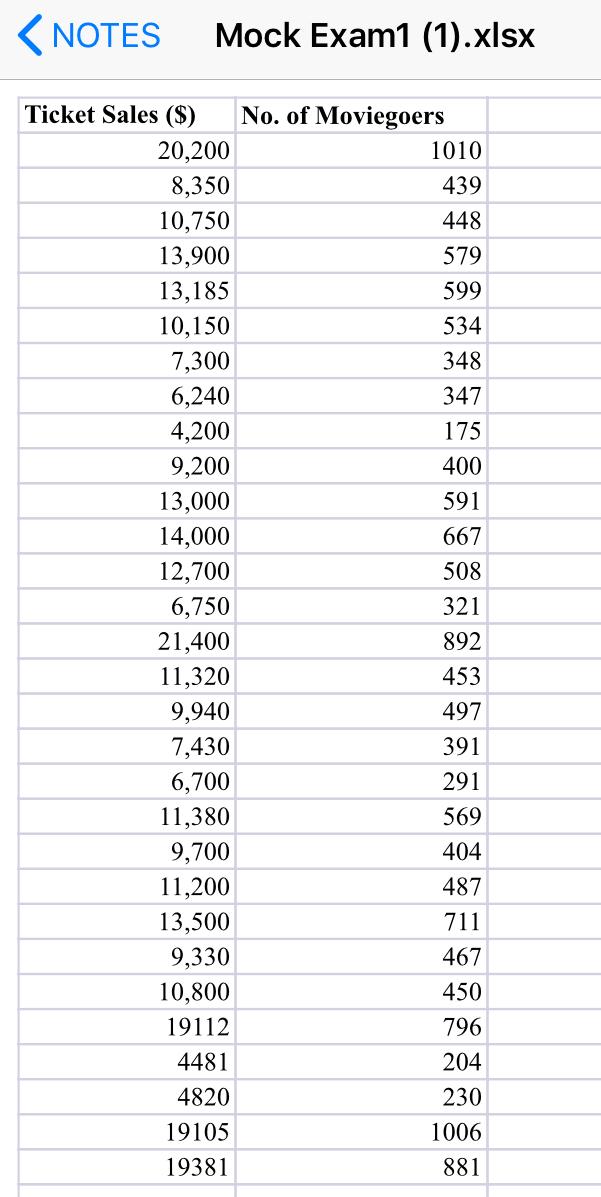
2. Create a percent frequency table of ticket sales , grouping the values from 4 , 200 to $21, 400, and every $2, 500 dollars a ) Now develop a pie chart for the percent frequencies , showing the labels in percentages b ) What is the most frequent range of sales and which percentage ?" 3 . What is the probability a theater in your population will have a revenue greater than $15 , 000This a random representative sample of ticket sales revenue for 30 theaters for a particular movie opening on a weekend and the*# of moviegoers The original population is normal and has the following parameter's The movie was originally shown in 3 , 118 theaters that weekend The mean sales revenue for all theater's was $1 1, 000 The standard deviation of the revenues for all theater's was $4 , 500 1 . Create a 5 - number summary of the ticket sales revenues 2. Create a percent frequency table of ticket sales , grouping the values from 4 , 200 to $21 , 400 , and every $2. 500 dollars a ) Now develop a pie chart for the percent frequencies , showing the labels in percentages b ) What is the most frequent range of sales and which percentage ?"4. Create a scatterplot for ticket sales and moviegoers in your sample , add a trendline and calculate the coefficient of correlation . Now explain the the nature of the relationhsip using your scatterplot and correlation coefficient 5 . If there is an average of 500 visitors in all theater's every weekend a movie is opening . what is the probability there will be at least 500 visitors next weekend a new movie is released ? Assume a Poisson Dist 6 . If in average 100 moviegoers come every hour during opening weekend , what is the probability there will be less than 5 min between incoming moviegoers during a given opening weekend ? Assume an Exponential Distribution\f

Step by Step Solution

There are 3 Steps involved in it

Step: 1

blur-text-image

Get Instant Access to Expert-Tailored Solutions

See step-by-step solutions with expert insights and AI powered tools for academic success

Step: 2

blur-text-image

Step: 3

blur-text-image

Ace Your Homework with AI

Get the answers you need in no time with our AI-driven, step-by-step assistance

Get Started

Recommended Textbook for

Precalculus

Authors: Michael Sullivan

9th edition

321716835, 321716833, 978-0321716835

More Books

Students also viewed these Mathematics questions