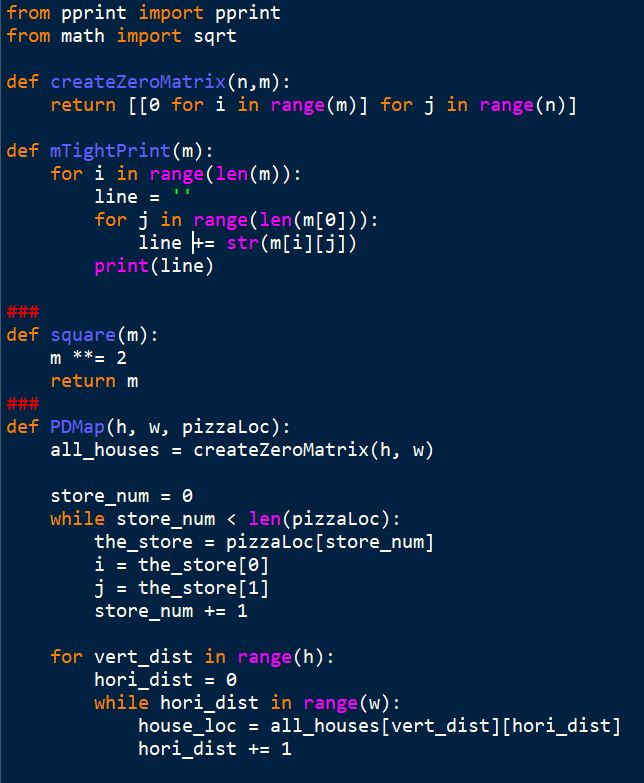
Hello tutors, how can I code for the function PDMap(h, w, PizzaLoc) for this assignment question below(in python)?
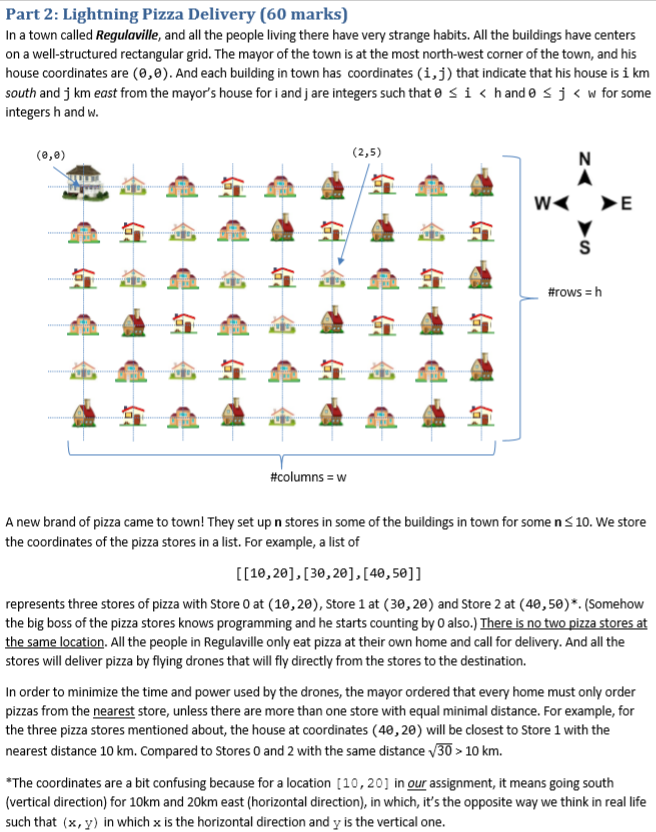
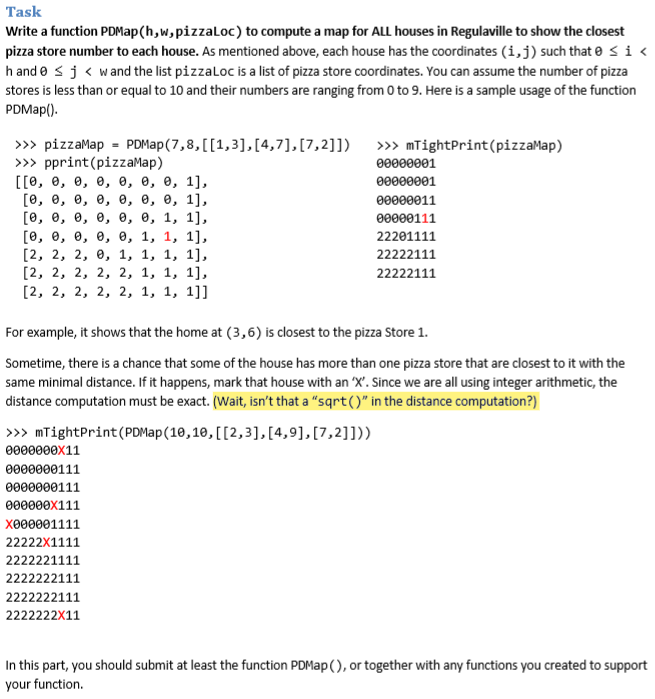
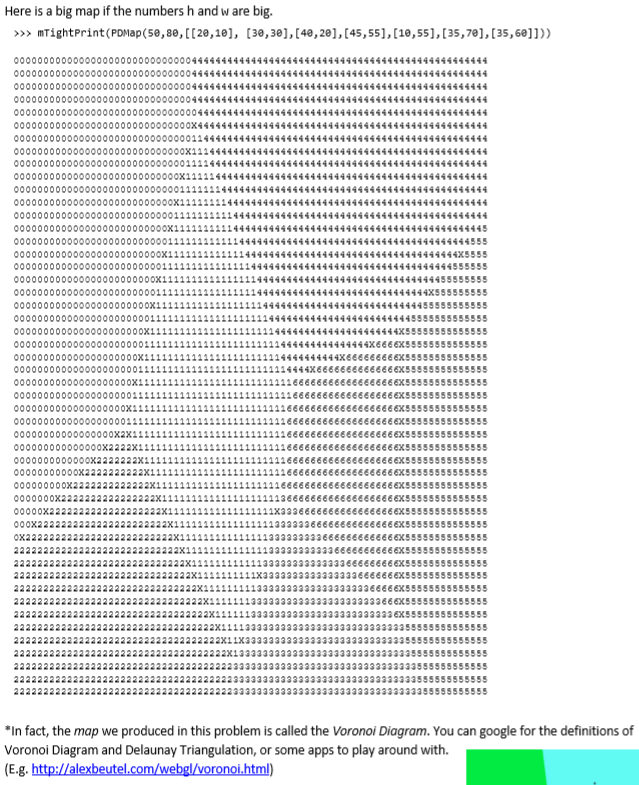
Part 2: Lightning Pizza Delivery (60 marks) In a town called Regulaville, and all the people living there have very strange habits. All the buildings have centers on a well-structured rectangular grid. The mayor of the town is at the most north-west corner of the town, and his house coordinates are (0, 0). And each building in town has coordinates (i, j) that indicate that his house is i km south and j km east from the mayor's house for i and j are integers such that @ S i Z W 10 km. "The coordinates are a bit confusing because for a location [10, 20] in our assignment, it means going south (vertical direction) for 10km and 20km east (horizontal direction), in which, it's the opposite way we think in real life such that (x, y) in which x is the horizontal direction and y is the vertical one.Task Write a function PDMap(h, w, pizzaLoc ) to compute a map for ALL houses in Regulaville to show the closest pizza store number to each house. As mentioned above, each house has the coordinates (i, j) such that 0 s i >> pizzaMap = PDMap(7, 8, [[1,3], [4,7], [7,2]]) > >> mTightPrint(pizzaMap) >>> pprint(pizzaMap) 90000001 [[0, 0, 0, 0, 0, 0, 0, 1], 90900001 [0, 0, 0, 0, 0, 0, 0, 1], 09000011 [0, 0, 0, 0, 0, 0, 1, 1], 90000111 [0, 0, 0, 0, 0, 1, 1, 1], 22201111 [2, 2, 2, 0, 1, 1, 1, 1], 22222111 [2, 2, 2, 2, 2, 1, 1, 1], 22222111 [2, 2, 2, 2, 2, 1, 1, 1]] For example, it shows that the home at (3, 6) is closest to the pizza Store 1. Sometime, there is a chance that some of the house has more than one pizza store that are closest to it with the same minimal distance. If it happens, mark that house with an 'X". Since we are all using integer arithmetic, the distance computation must be exact. (Wait, isn't that a "sqet ( )" in the distance computation?) > > > mTightPrint(PDMap(10, 10, [[2,3], [4,9], [7,2]1)) 9000060x11 0000000111 0000900111 000090X111 X090901111 22222X1111 2222221111 2222222111 2222222111 2222222X11 In this part, you should submit at least the function PDMap (), or together with any functions you created to support your function.Here is a big map if the numbers h and w are big. >>> mTightPrint(PDMap(50, 80, [[20, 10], [30,30], [40,20], [45,55], [10,55], [35,70], [35,60]])) 0808080806080808080806060800X14111444144444444144444444444464141414441414141444 08080805060808080809009080001111144444444444414444444444464641414441414141414 "In fact, the map we produced in this problem is called the Voronoi Diagram. You can google for the definitions of Voronoi Diagram and Delaunay Triangulation, or some apps to play around with. (E.g. http://alexbeutel.com/webgl/voronoi.html)\f


