

Question
Hello tutors, I tried working on this by watching stats videos on youtube and pieces of information from this site. Can you verify if the
Hello tutors, I tried working on this by watching stats videos on youtube and pieces of information from this site. Can you verify if the workup is correct? Your help is appreciated. This class is not my strenght so it will be a great achievement. Thank you!
Indicate whether the following generalizations suggest a positive or negativerelationship. Also speculate aboutwhether or notthese generalizations reflectsimple cause-effect relationships.
(a) Preschool children who delay gratification (postponing eating one marshmallow towin two) subsequently receive higher teacher evaluations of adolescent competencies.
This is a negative relationship. This is not a cause effect relationship as there many factors that play a role inchildren receiving higher evaluations. For instance, the child may not delay postponing marshmallow simply because it doesn't like it. Additionally, student ranking.
(b) College students who take longer to finish a test perform more poorly on that test
This is a negative relationship. This is not a cause effect relationship as students who take longer may fall under different factors such as carefulness, anxiety- ability for test taking, underlining causes as reading abilities that may slow down understanding, orsimply reviewing material, to name a few.
(c) Heavy smokers have shorter life expectancies.
This is a negative relationship. This is not a cause effect relationship as heavy smokers may potentially live a healthier lifestyle such as eating, exercise, andgenetics.
(d) Infants who experience longer durations of breastfeeding score higher on IQ tests in later childhood.
This is a negative relationship. This is not a cause effect relationship as infantsas several factors can impact thechildsIQ score such as education, learning ability, resources, and even privileges, to name a few.
Exercise 7.8
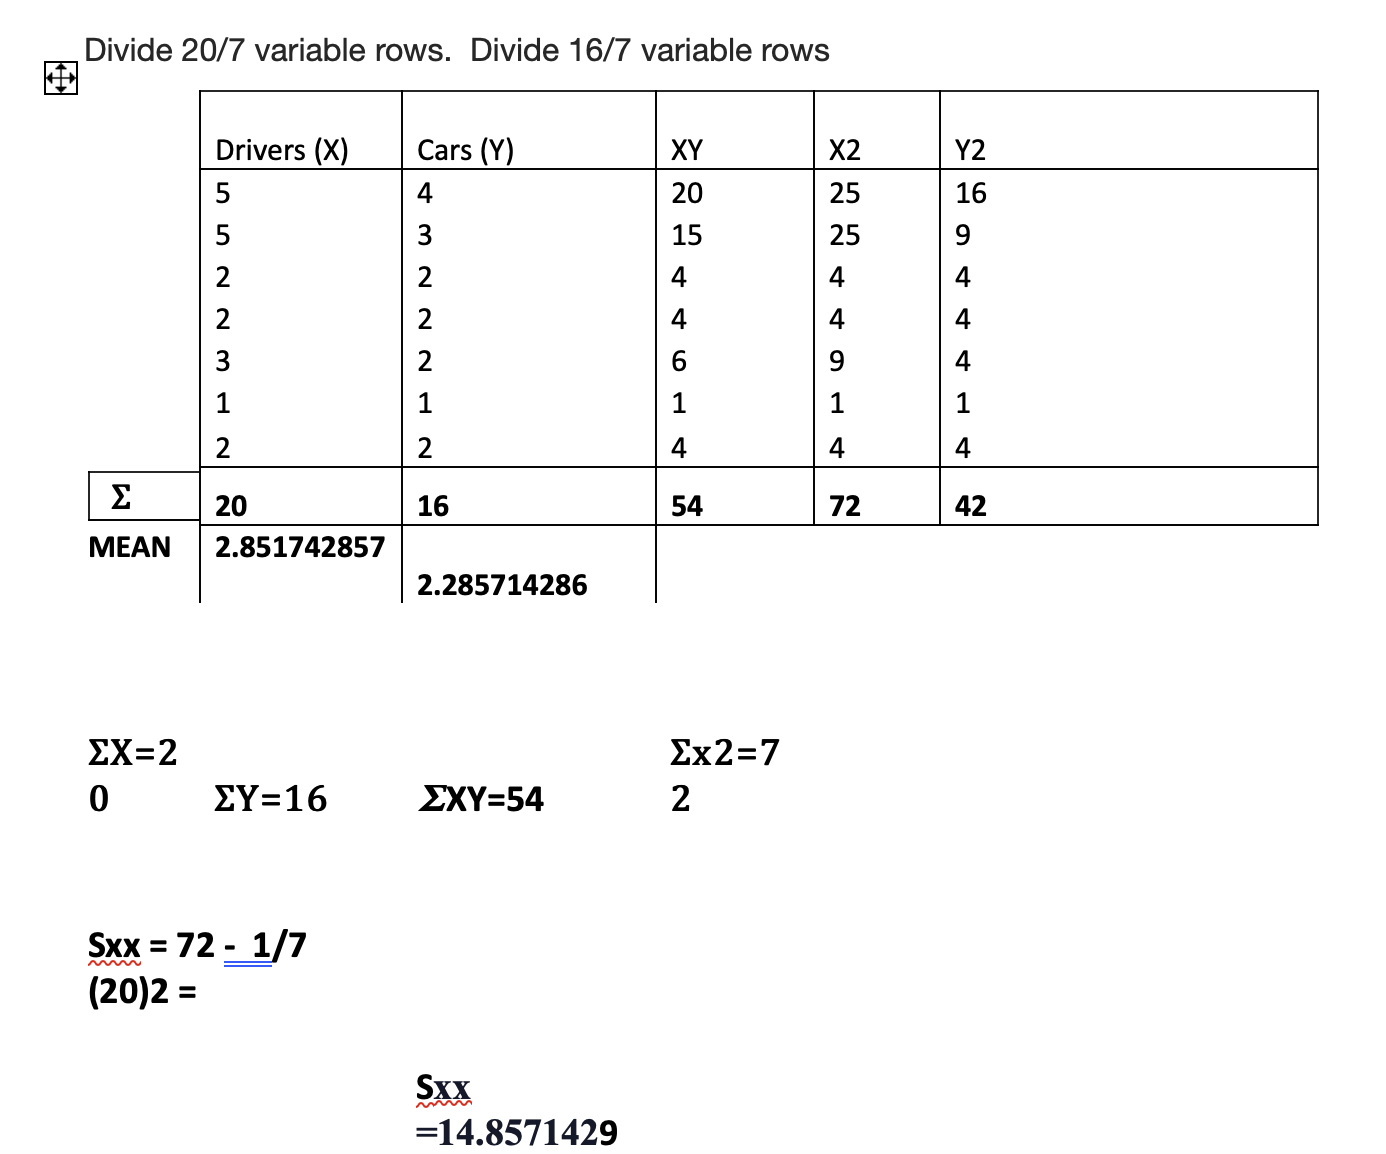
Each of the following pairs represents the number of licensed drivers (X )and thenumber of cars (Y )for seven houses in my neighborhood:
Drivers (X)
5
5
2
2
3
1
2
Cars (Y)
4
3
2
2
2
1
2
(a) Construct a scatterplot to verify a lack of pronounced curvilinearity.
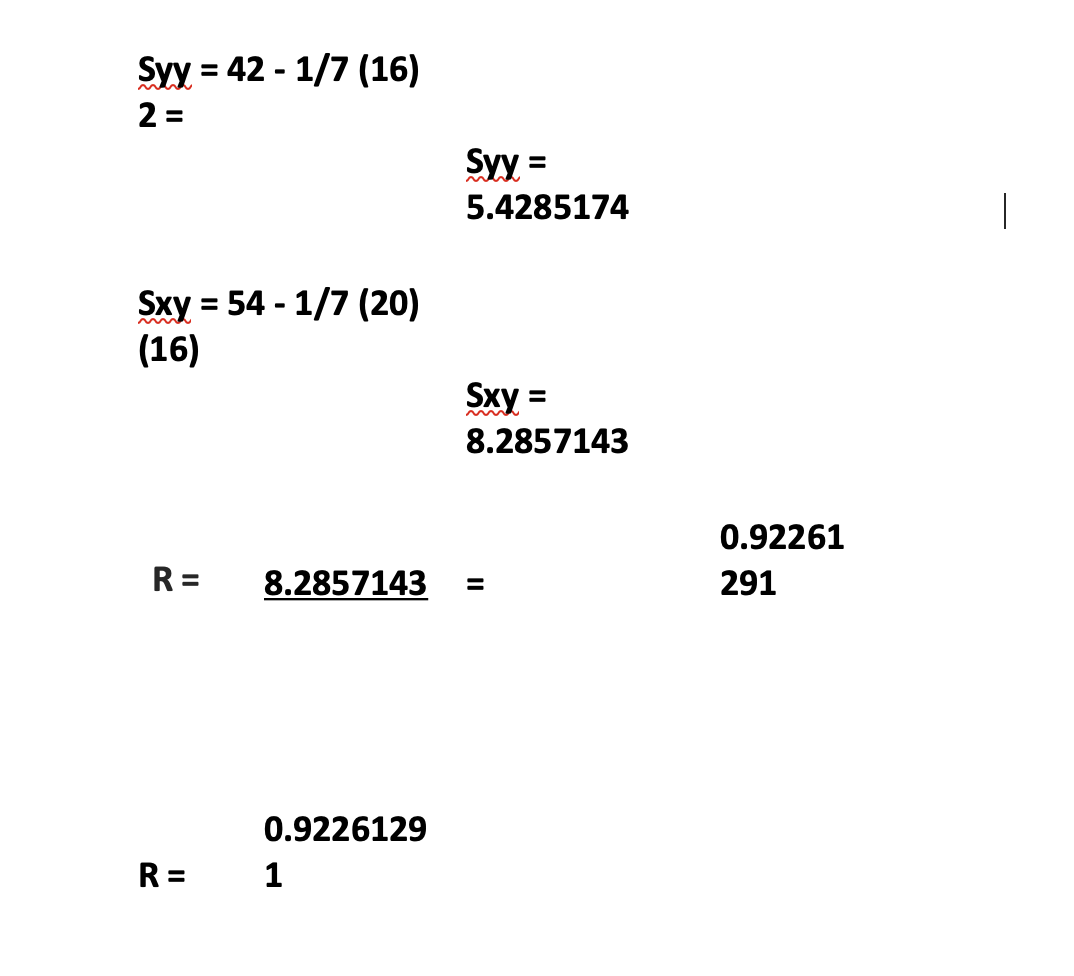
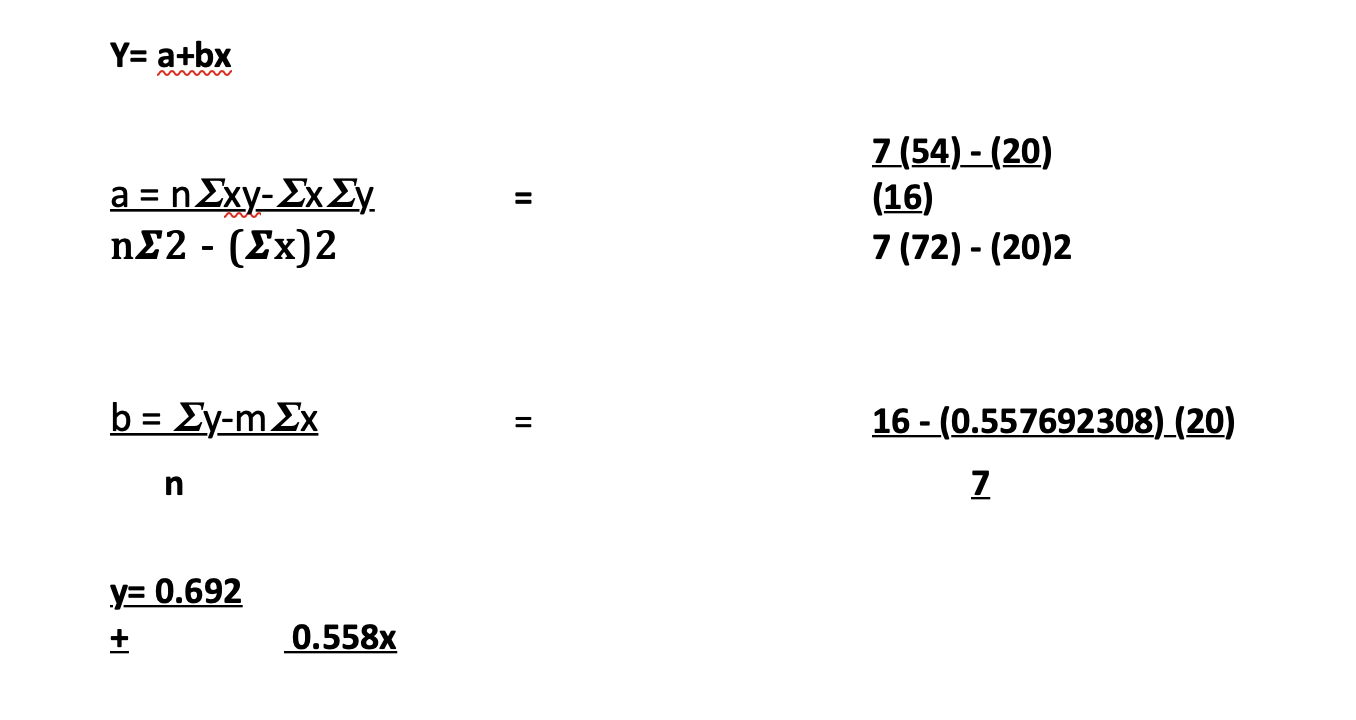
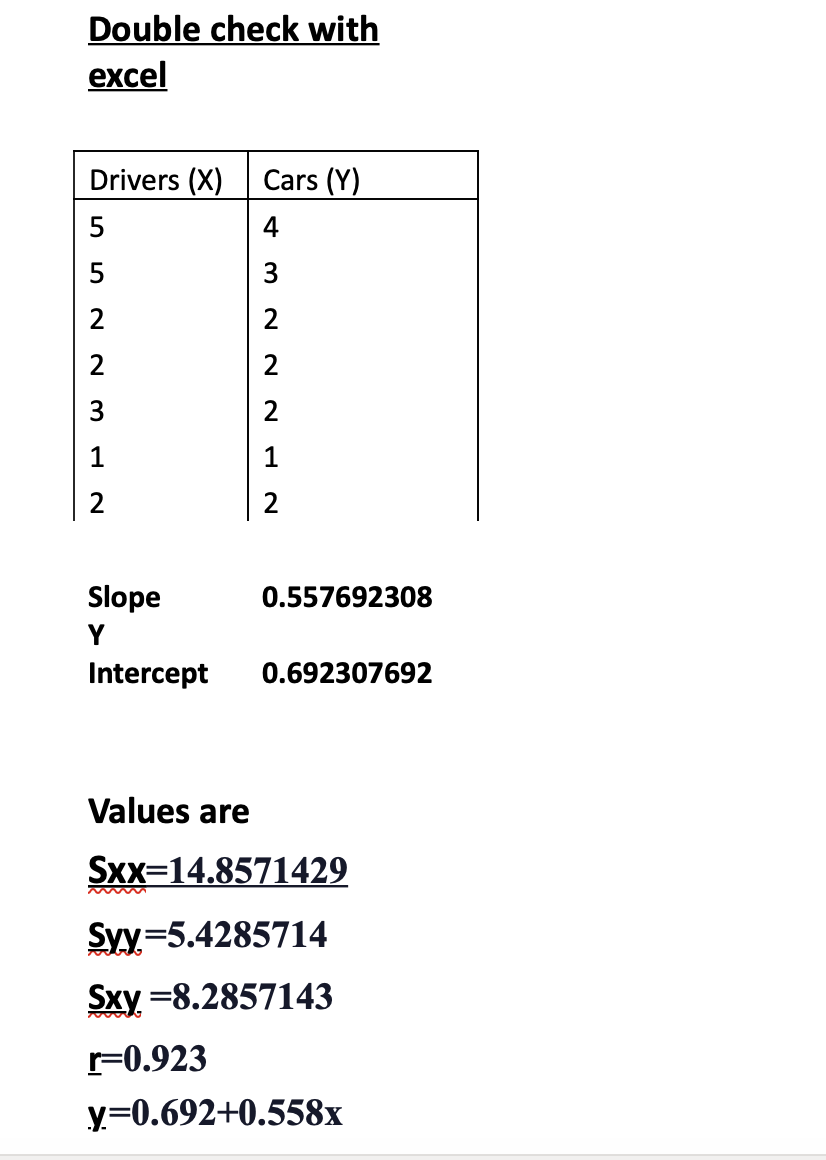
(b) Determine the least squares equation for these data. (Remember, you will first haveto calculate r, SSy and SSx)
(c) Determine the standard error of estimate, sy|x, given that n = 7.
(d) Predict the number of cars for each of two new families with two and five drivers
Step by Step Solution
There are 3 Steps involved in it
Step: 1

Get Instant Access to Expert-Tailored Solutions
See step-by-step solutions with expert insights and AI powered tools for academic success
Step: 2

Step: 3
Ace Your Homework with AI
Get the answers you need in no time with our AI-driven, step-by-step assistance
Get Started
An Introduction to the Mathematics of financial Derivatives
Authors: Salih N. Neftci
2nd Edition
978-0125153928, 9780080478647, 125153929, 978-0123846822