Help, I am not sure how to explain question two. Exercise 39 Perceptions of Risky Driving Behaviors t Test for Independent Groups: III Statistical Guide
Help, I am not sure how to explain question two.
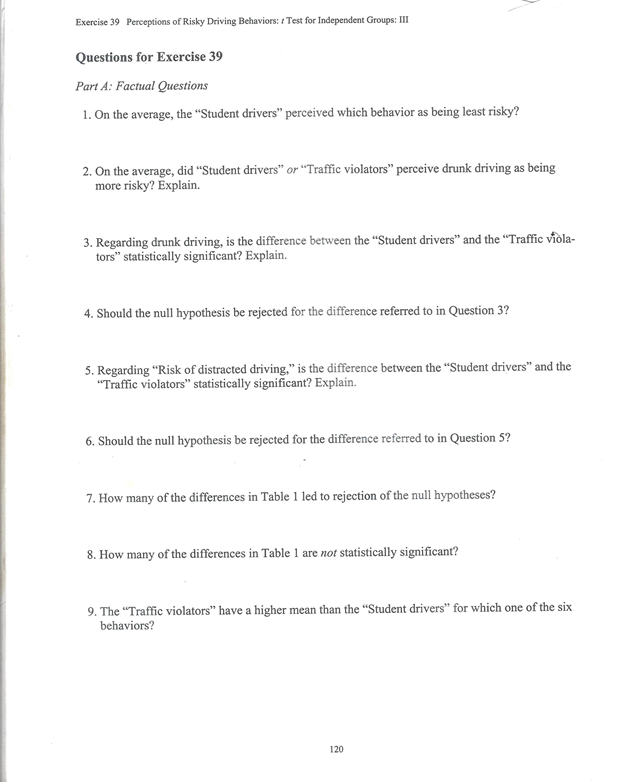
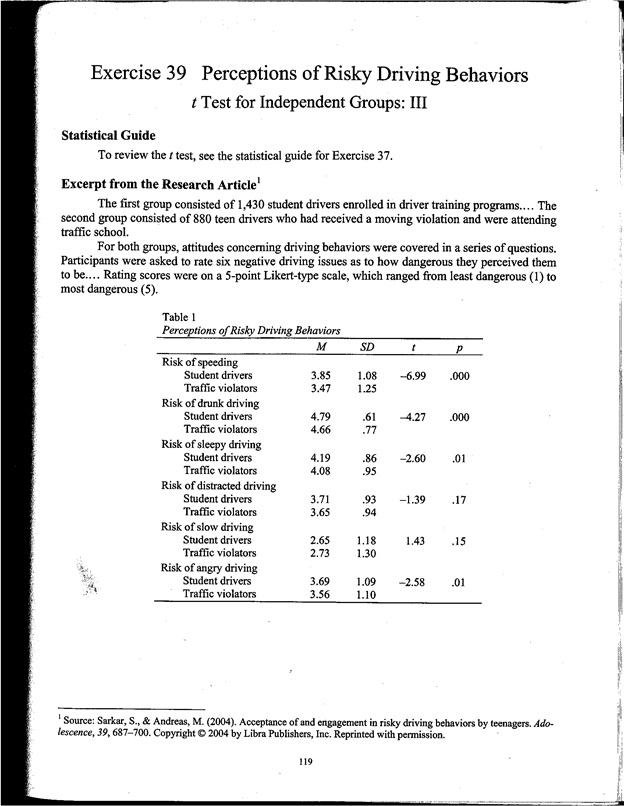
Exercise 39 Perceptions of Risky Driving Behaviors t Test for Independent Groups: III Statistical Guide To review the / test, see the statistical guide for Exercise 37. Excerpt from the Research Article The first group consisted of 1,430 student drivers enrolled in driver training programs.... The second group consisted of 880 teen drivers who had received a moving violation and were attending traffic school. For both groups, attitudes concerning driving behaviors were covered in a series of questions. Participants were asked to rate six negative driving issues as to how dangerous they perceived them to be.... Rating scores were on a 5-point Likert-type scale, which ranged from least dangerous (1) to most dangerous (5). Table 1 Perceptions of Risky Driving Behaviors M SD P Risk of speeding Student drivers 3.85 1.08 -6.99 .000 Traffic violators 3.47 1.25 Risk of drunk driving Student drivers 4.79 61 -4.27 .000 Traffic violators 4.66 .77 Risk of sleepy driving Student drivers 4.19 86 -2.60 .01 Traffic violators 4.08 95 Risk of distracted driving Student drivers 3.71 .93 -1.39 .17 Traffic violators 3.65 94 Risk of slow driving Student drivers 2.65 1.18 1.43 .15 Traffic violators 2.73 1.30 Risk of angry driving Student drivers 3.69 1.09 -2.58 .01 Traffic violators 3.56 1.10 Source: Sarkar, S., & Andreas, M. (2004). Acceptance of and engagement in risky driving behaviors by teenagers. Ado- lescence, 39, 687-700. Copyright @ 2004 by Libra Publishers, Inc. Reprinted with permission. 119Exercise 39 Perceptions of Risky Driving Behaviors: / Test for Independent Groups: III Questions for Exercise 39 Part A: Factual Questions 1. On the average, the "Student drivers" perceived which behavior as being least risky? 2. On the average, did "Student drivers" or "Traffic violators" perceive drunk driving as being more risky? Explain. 3. Regarding drunk driving, is the difference between the "Student drivers" and the "Traffic viola- tors" statistically significant? Explain. 4. Should the null hypothesis be rejected for the difference referred to in Question 3? 5. Regarding "Risk of distracted driving," is the difference between the "Student drivers" and the "Traffic violators" statistically significant? Explain. 6. Should the null hypothesis be rejected for the difference referred to in Question 5? 7. How many of the differences in Table 1 led to rejection of the null hypotheses? 8. How many of the differences in Table 1 are not statistically significant? 9. The "Traffic violators" have a higher mean than the "Student drivers" for which one of the six behaviors? 120
Step by Step Solution
There are 3 Steps involved in it
Step: 1
Get Instant Access to Expert-Tailored Solutions
See step-by-step solutions with expert insights and AI powered tools for academic success
Step: 2
Step: 3
Ace Your Homework with AI
Get the answers you need in no time with our AI-driven, step-by-step assistance