Help in need, please. sorry for the long description...
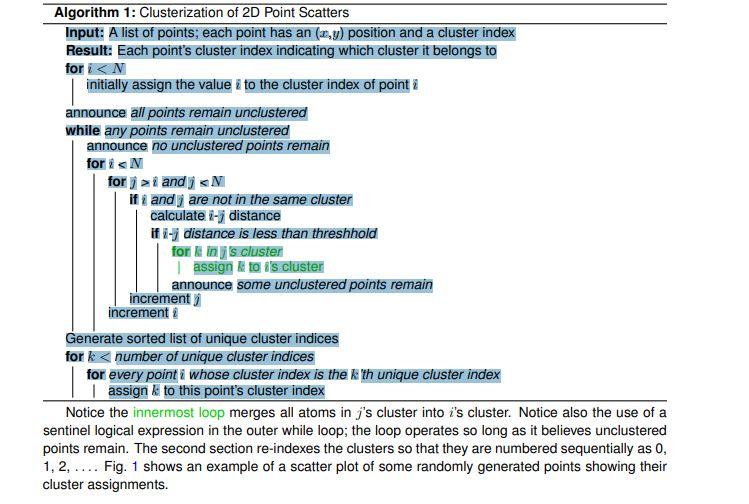
Write a Python program that will read in a set of 2D (x, y) points and, using a distance-based criterion, assign each point to a cluster. The criterion for deciding whether any two points belong to the same cluster is whether the distance between them is below some predefined threshhold value. An algorithm for identifying clusters in a for a set of points is below.
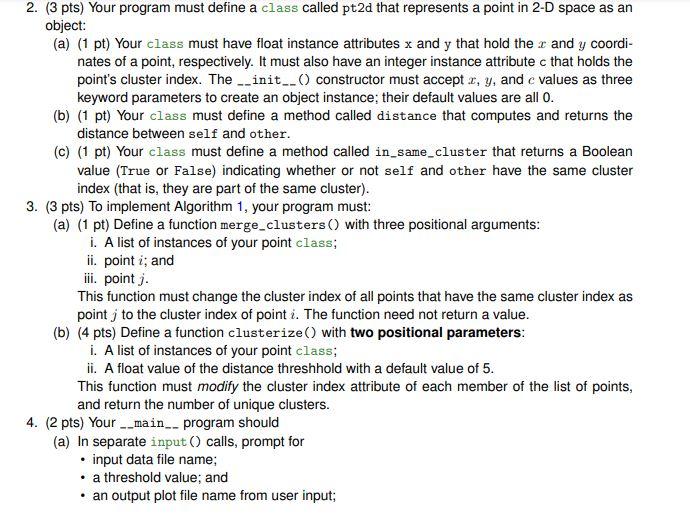
PYTHON PROGRAM REQUIREMENTS
Algorithm 1: Clusterization of 2D Point Scatters Input: A list of points; each point has an (x,y) position and a cluster index Result: Each point's cluster index indicating which cluster it belongs to for i
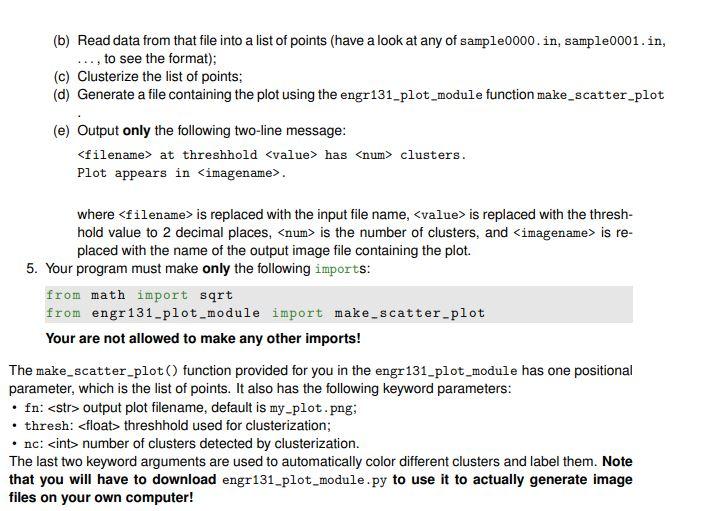
i andj s if i and are not in the same cluster calculate 2-7 distance if - distance is less than threshhold for ny s cluster | assign to is cluster announce some unclustered points remain increment increment Generate sorted list of unique cluster indices for k at threshhold has clusters. Plot appears in where is replaced with the input file name, is replaced with the thresh- hold value to 2 decimal places, is the number of clusters, and is re- placed with the name of the output image file containing the plot. 5. Your program must make only the following imports: from math import sort from engr131_plot_module import make scatter-plot Your are not allowed to make any other imports! The make_scatter_plot() function provided for you in the engr 131_plot_module has one positional parameter, which is the list of points. It also has the following keyword parameters: fn: output plot filename, default is my-plot.png; thresh: threshhold used for clusterization; nc: number of clusters detected by clusterization. The last two keyword arguments are used to automatically color different clusters and label them. Note that you will have to download engr131_plot_module.py to use it to actually generate image files on your own computer! . Algorithm 1: Clusterization of 2D Point Scatters Input: A list of points; each point has an (x,y) position and a cluster index Result: Each point's cluster index indicating which cluster it belongs to for i i andj s if i and are not in the same cluster calculate 2-7 distance if - distance is less than threshhold for ny s cluster | assign to is cluster announce some unclustered points remain increment increment Generate sorted list of unique cluster indices for k at threshhold has clusters. Plot appears in where is replaced with the input file name, is replaced with the thresh- hold value to 2 decimal places, is the number of clusters, and is re- placed with the name of the output image file containing the plot. 5. Your program must make only the following imports: from math import sort from engr131_plot_module import make scatter-plot Your are not allowed to make any other imports! The make_scatter_plot() function provided for you in the engr 131_plot_module has one positional parameter, which is the list of points. It also has the following keyword parameters: fn: output plot filename, default is my-plot.png; thresh: threshhold used for clusterization; nc: number of clusters detected by clusterization. The last two keyword arguments are used to automatically color different clusters and label them. Note that you will have to download engr131_plot_module.py to use it to actually generate image files on your own computer<><>