
Help in solving the following questions please
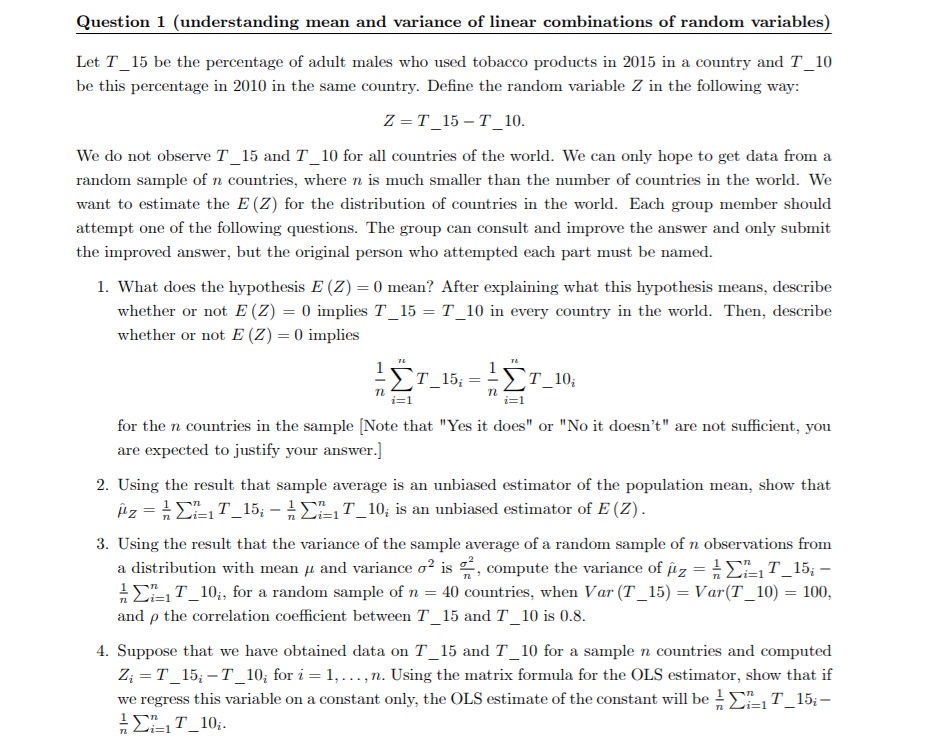
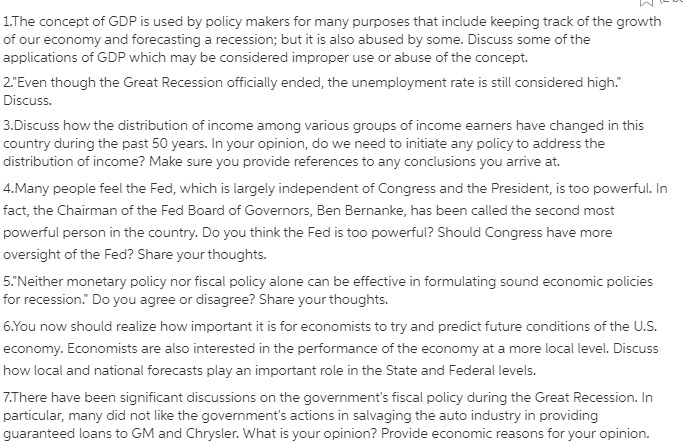
Question 1 (understanding mean and variance of linear combinations of random variables) Let T_15 be the percentage of adult males who used tobacco products in 2015 in a country and T_10 be this percentage in 2010 in the same country. Define the random variable Z in the following way: Z =T_15 -T_10. We do not observe T_15 and T_10 for all countries of the world. We can only hope to get data from a random sample of n countries, where n is much smaller than the number of countries in the world. We want to estimate the E (Z) for the distribution of countries in the world. Each group member should attempt one of the following questions. The group can consult and improve the answer and only submit the improved answer, but the original person who attempted each part must be named. 1. What does the hypothesis E (Z) = 0 mean? After explaining what this hypothesis means, describe whether or not E (Z) = 0 implies T_15 = T_10 in every country in the world. Then, describe whether or not E (Z) = 0 implies -Er_15; = -Er_10; 1= 1 1= 1 for the n countries in the sample [Note that "Yes it does" or "No it doesn't" are not sufficient, you are expected to justify your answer.] 2. Using the result that sample average is an unbiased estimator of the population mean, show that iz = MET_15; - MELT_10; is an unbiased estimator of E (Z) . 3. Using the result that the variance of the sample average of a random sample of n observations from a distribution with mean / and variance o' is , compute the variance of /z = > >_,T_15; - " Ein T_10;, for a random sample of n = 40 countries, when Var (T_15) = Var(T_10) = 100, and p the correlation coefficient between 7_15 and T_10 is 0.8. 4. Suppose that we have obtained data on T_15 and T_10 for a sample n countries and computed Z; =T_15; -T_10; for i = 1, ..., n. Using the matrix formula for the OLS estimator, show that if we regress this variable on a constant only, the OLS estimate of the constant will be ! )_, T_15;- = ELIT_10.Question 1 (understanding mean and variance of linear combinations of random variables) Let T_15 be the percentage of adult males who used tobacco products in 2015 in a country and T_10 be this percentage in 2010 in the same country. Define the random variable Z in the following way: Z =T_15 -T_10. We do not observe T_15 and T_10 for all countries of the world. We can only hope to get data from a random sample of n countries, where n is much smaller than the number of countries in the world. We want to estimate the E (Z) for the distribution of countries in the world. Each group member should attempt one of the following questions. The group can consult and improve the answer and only submit the improved answer, but the original person who attempted each part must be named. 1. What does the hypothesis E (Z) = 0 mean? After explaining what this hypothesis means, describe whether or not E (Z) = 0 implies T_15 = T_10 in every country in the world. Then, describe whether or not E (Z) = 0 implies -Er_15; = -Er_10; 1= 1 1= 1 for the n countries in the sample [Note that "Yes it does" or "No it doesn't" are not sufficient, you are expected to justify your answer.] 2. Using the result that sample average is an unbiased estimator of the population mean, show that iz = MET_15; - MELT_10; is an unbiased estimator of E (Z) . 3. Using the result that the variance of the sample average of a random sample of n observations from a distribution with mean / and variance o' is , compute the variance of /z = > >_,T_15; - " Ein T_10;, for a random sample of n = 40 countries, when Var (T_15) = Var(T_10) = 100, and p the correlation coefficient between 7_15 and T_10 is 0.8. 4. Suppose that we have obtained data on T_15 and T_10 for a sample n countries and computed Z; =T_15; -T_10; for i = 1, ..., n. Using the matrix formula for the OLS estimator, show that if we regress this variable on a constant only, the OLS estimate of the constant will be ! )_, T_15;- = ELIT_10.rnr r'- r" 1.The concept of GDP is used by policy makers for many purposes that include keeping track ofthe growth of our economy and forecasting a recession; but it is also abused by some. Discuss some of the applications of GDP which may be considered improper use or abuse of the concept. 2." Even though the Great Recession ofcially ended, the unemployment rate is still considered high.' Discuss. 3.Discuss how the distribution of income among various groups of income earners have changed in this country during the past 5D years. in your opinion, do we need to initiate any policy to address the distribution of income? Make sure you provide references to anyconclusions you arrive at. 4.Many people feet the Fed, which is largely independent of Congress and the President, is too powerful. In fact, the Chairman of the Fed Board of Governors, Ben Bernanke, has been called the second most powerful person in the country. Do you think the Fed is too powerful? Should Congress have more oversight of the Fed? Share your thoughts. 5."N either monetary policy nor fiscal policy alone can be effective in formulating sound economic policies for recession.' Do you agree or disagree? Share your thoughts. Effou now should realize how important it is for economists to try and predict future conditions of the LLB. economy. Economists are also interested in the performance of the economy at a more local level. Discuss how local and national forecasts play an important role in the State and Federal levels. If here have been significant discussions on the government's scal policy during the Great Recession. in particular, many did not like the government's actions in salvaging the auto industry in providing guaranteed loans to GM and Chrysler. What is your opinion? Provide economic reasons for your opinion. Question 1 There are 10,000 identical individuals in the market for commodity X, each with a demand function given by Qodx = 12 - 2Px, and 1000 identical producers of commodity X, each with a function given by Qsx = 20 Px. where Qox is an individual's quantity demanded, Qsx is a single producer's quantity supplied, and Px is the price of the commodity. (a) Find the market demand function (QDx) and the market supply function (QSx) for commodity X (b) Determine the market demand schedule and the market supply schedule of commodity X (for whole dollar prices) and from them find the equilibrium price and the equilibrium quantity. (c) Plot, on one set of axes, the market demand curve and the market supply curve for commodity X and show the equilibrium point (d) Obtain the equilibrium price and the equilibrium quantity mathematically. (e) Explain why the equilibrium condition is considered stable. (f) Determine the elasticity of demand for commodity X at the equilibrium point. Question 2 Suppose that from the condition of equilibrium in Question 1, there is an increase in consumers' incomes (ceteris paribus) so that a new market demand curve is given by QDx = 140,000 - 20,000Px. (a) Derive the new market demand schedule (b) Show the new market demand curve on the graph used in Question 1(c) (c) State the new equilibrium price and equilibrium quantity for commodity X (d) Determine the Income Elasticity at the original equilibrium price and at the new equilibrium price. (Assume that the increase in income is 106). (e) In the light of your answer to 2 (d), comment on the nature of commodity X