


:Help me answer all questions .
This problem examines the effects of an increase in ?on the optimal choice of the fraction of risky assets (?) in the portfolio choice model presented in Lecture 10. Recall that the problem is what fraction (?) of wealth (W) a consumer should hold in risky assets. The risk-free asset has a gross return equal to r, and the risky asset has a gross return equal to ? with probability p (and 0 with probability 1-p). The consumer's utility of wealth is given by U(W) = lnW. Recall that we showed that the optimal level of ? is given by: ?*=(p?- r) /(?- r)
Pick what you consider to be realistic values for the parameters p and r, and then see
if ?* increases as you increase ? using Excel. Submit an Excel spreadsheet containing a scatterplot of (x, y) = (?,?*) to demonstrate whether increasing the gross return causes people to invest more heavily in the risky asset. Decision Theory Problem with a Risk Neutral Firm
3. Consider a risk-neutral firm that operates for two periods with a production function that depends only on the amount of labor hired: f(L) = 100L^ 1/2 Assume that the
interest rate (r) is equal to 5%. The wage in the first period is equal to $10 per hour, but the second period's wage is either $10 (with probability 0.4) or $20 (with probability 0.6). The current price for the firm's output is Po =$20. In the second period, the price is either P1=$20 (with probability ) or P1=$30 (with probability ).
a) Assuming the firm cannot store output over time, what is the expected value of the presented discounted value of lifetime profits for this firm?
(Hint: Recall that if you receive a cash flow = CF in T years in the future, the value of this cash flow today (i.e. the present discounted value of CF) is equal to CF/(1+r)^T.)
b) Find the expected profit maximizing choice of labor in both periods.
c) Given the levels of labor you found in part b, what are the corresponding levels of output?
d) Now suppose the firm hires union workers that demand a two period contract. In other words, the same amount of labor must be hired in both periods (but the wages may be different in the two periods). How will the firm's optimal choice of labor be affected by this labor market rigidity?
e) Now suppose the firm has access to inventory storage that costs h(s) = s2 in the second period, where s is the amount stored in inventories. Assuming labor market rigidity as in part d, how does the introduction of inventory storage change the firm's behavior?
f) Explain the intuition behind the firm's behavior in part
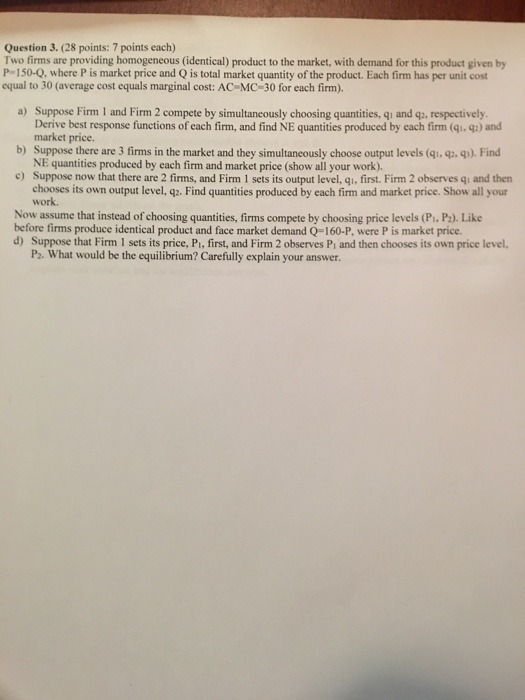
53. Assume the spot rates for year 1, year 2 and year 3 are 3.5%, 4% and 4.5%, respectively. There are a 3-year zero coupon bond and a 3-year coupon bond that pays a 5% coupon annually. (a) What are the YTMs of the bonds? (b) Calculate all 1-year forward rates. (c) Calculate the realized returns of the two bonds over the next year if the yield curve does not change. (In year 1 the 1-year spot rate is 3.5%, the 2-year spot rate is 4% and the 3-year spot rate is 4.5%.) 54. A pension plan is obligated to make disbursements of $1 million, $2 million and $1 million at the end of each of the next three years, respectively. Find the durations of the plan's obligations if the interest rate is 10% annually. 55. A local bank has the following balance sheet: Asset Liability Loans $100 million | Deposits $90 million Equity $10 million The duration of the loans is 4 years and the duration of the deposits is 2 years. (a) What is the duration of the bank's equity? How would you interpret the duration of the equity? (b) Suppose that the yield curve moves from 6% to 6.5%. What is the change in the bank's equity value? The term structure is flat at 6%. A bond has 10 years to maturity, face value $100, and annual coupon rate 5%. Interest rates are expressed as EARs. 56. (a) Compute the bond price. (b) Compute the bond's duration and modified duration. (c) Suppose the term structure moves up to 7% (still staying flat). What is the bond's new price' (d) Compute the approximate price change using duration, and compare it to the actual price change. 57. Suppose Microsoft, which has billions invested in short-term debt securities, undertakes the following two-step transaction on Dec. 30, 2009. (1) Sell $1 billion market value of 6-month U.S. Treasury bills yielding 4% (6 month spot rate). (2) Buy $1 billion of 10- year Treasury notes. The notes have a 5.5% coupon and are trading at par. Microsoft does not need the $1 billion for its operations and will hold the notes to maturity. Fall 2008 Page 24 of 66 (a) What is the impact of this two-step transaction on Microsoft's earnings for the first 6 months of 2010? (b) What is the transaction's NPV? Briefly explain your answers. 58. The Treasury bond maturing on August 15, 2017 traded at a closing ask price of 133:16 (i.e., $133 16/32) on August 31, 2007. The coupon rate is 8.875%, paid semi-annually. The yield to maturity was 4.63% (with semi-annual compounding). (a) Explain in detail how this yield to maturity was calculated. (b) Discount the bond's cash flows, using the yield to maturity. Can you replicate the ask price? (The replication should be close but won't be exact.) Show your calculations.Question 2. (15 points: 5 points each) There are a players in the economy and each player has an option to use the commons. The total production function from the commons is given by F(m)-10m-m, where at is the number of players using the commons, 05mSn. Every player using the commons gets an equal share of total production, i.c. the payoff to each player using the commons is Fymi'm. If a player is not using the commons he/she gets a payoff 1. a) What is the Socially Optimal number of players using the commons (i.e. maximizing total production)? b) What is the NE number of players using the commons? c) Why does this problem belong to a class of problems called Social Dilemmas? Explain.Question 4. (35 points: 7 points cach) Consider a two-player game represented by a normal form table below. Player 2 A B Player 1 A 5.5 1. 6 B 6. 1 0,0 Players simultaneously choose among two available choices A and B. a) Are there any pure strategy NE of this one-shot game? Explain your answer. b) Allowing for mixed strategies, carefully derive best response functions for each player. Show all your work and state clearly the resulting best responses. c) Plot best response functions obtained in part (b) on the graph (label the axis and each best response function). Show all NE on the graph. d) Identify all NE of this game (listing corresponding strategies). List (expected) payoffs of each player in every case. e) Suppose Player I moves first. Player 2 observes the choice by Player 1, and then makes their own choice, A or B. Draw extensive form of this game, and identify subgame perfect equilibrium. Carefully explain your solution and the equilibrium outcome.Question 3. (28 points: 7 points each) Two firms are providing homogeneous (identical) product to the market, with demand for this product given by P-150-Q. where P is market price and Q is total market quantity of the product. Each firm has per unit cost equal to 30 (average cost equals marginal cost: AC-MC-30 for each firm). a) Suppose Firm 1 and Firm 2 compete by simultaneously choosing quantities, qu and qu, respectively. Derive best response functions of each firm, and find NE quantities produced by each firm (q1, q2) and market price. b) Suppose there are 3 firms in the market and they simultaneously choose output levels (qi, q. q ). Find NE quantities produced by each firm and market price (show all your work). c) Suppose now that there are 2 firms, and Firm I sets its output level, qi. first. Firm 2 observes qi and then chooses its own output level, q2. Find quantities produced by each firm and market price. Show all your work. Now assume that instead of choosing quantities, firms compete by choosing price levels (PI, P;). Like before firms produce identical product and face market demand Q-160-P. were P is market price. d) Suppose that Firm I sets its price, Pi, first, and Firm 2 observes Pi and then chooses its own price level. Pa. What would be the equilibrium? Carefully explain your answer.3. Consider an economy that has equal percentages of two types of riskaaverse people, clean-living (type C) and dissolute (type D). The probability of being sick (3] or healthyfuot sick {NS} for both types is given below: \" \"\" Both types have wealth equal to $211!] if they are healthy, but they have to pay $15 in medical bills if they are sick. They both also have the same utility function: UPI?) = W\". In this problem, these people will try to buy health insurance from risk neutral rms that have zero expected prots because of competition. a] b] 3) What is the level of expected wealth and expected utility for each type when people cannot buy insurance (round to 2 decimal points)? Do a state-space diagram with a person's wealth when he is healthyfnot sick on the vertical axis (and a person's wealth when he is sick on the horizontal axis], illustrate the indifference curves for both types of people through the endowment point when no insurance policies are purchased. Be sure to include the level of expected utility for each type's indifference curves as calculated in part a. Calculate the Islopel of the indifference curve for each type of person along the full insurance line. Assuming rms had full information, how much would firms charge for the premium and deductible for full coverage for clean-living types? Label this contract C] on your diagram. Also draw the indifference curve for type C people through Cl and indicate the new level of expected utility {as compared to not having insurance]. Repeat part d for dissolute type people, but label this contract C2 on a separate diagram (or on the same diagram if you prefer). Assuming incomplete information, explain why Cl is not a possible pooling equibrium. That is, explain why rms cannot or would not offer the same contract, C1, to both types C and D. If the governmut forced companies to offer only a pooling contract where rms made zero expected prots and offered full coverage to both types, what would this contract look like {i.e. what would be the premium and claim for this policy)? Label this contract CE: and illustrate it on a new diagram. Show the indifference curves through C3 as well as the levels of expected utility for each type on the diagram. Explain in detail why C3 in the absence of government intervention is not an equihbrium. Include in your answer an example of a contract labeled C4 that would break the pooling equilibrium contract C3. Please illustrate C4 on your graph and include the graph in your explanation