Help me. Below is format to answer. And only use the provided z-table below pls. Z table below the question is provided Find the area
Help me. Below is format to answer. And only use the provided z-table below pls. Z table below the question is provided
Find the area under the normal curve in each of the cases
Between z = -1.2 and z = 2.4
Between z = 1.23 and z = 1.87
To the left of z = -1.78
To the right of z = 2.20
Between z = -2.21 and -0.46
To the right of z = 1.83 and to the left of z = -2.52
Problem
If the height of 300 students are normally distributed with 68 inches and the standard deviation is 3 inches, how many students have the height:
greater than 72 inches
less than 64 inches
between 65 and 71 inches
equal to 68 inches
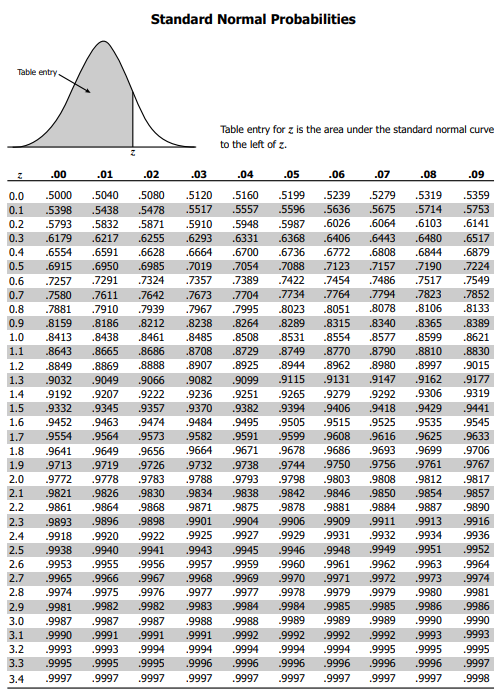
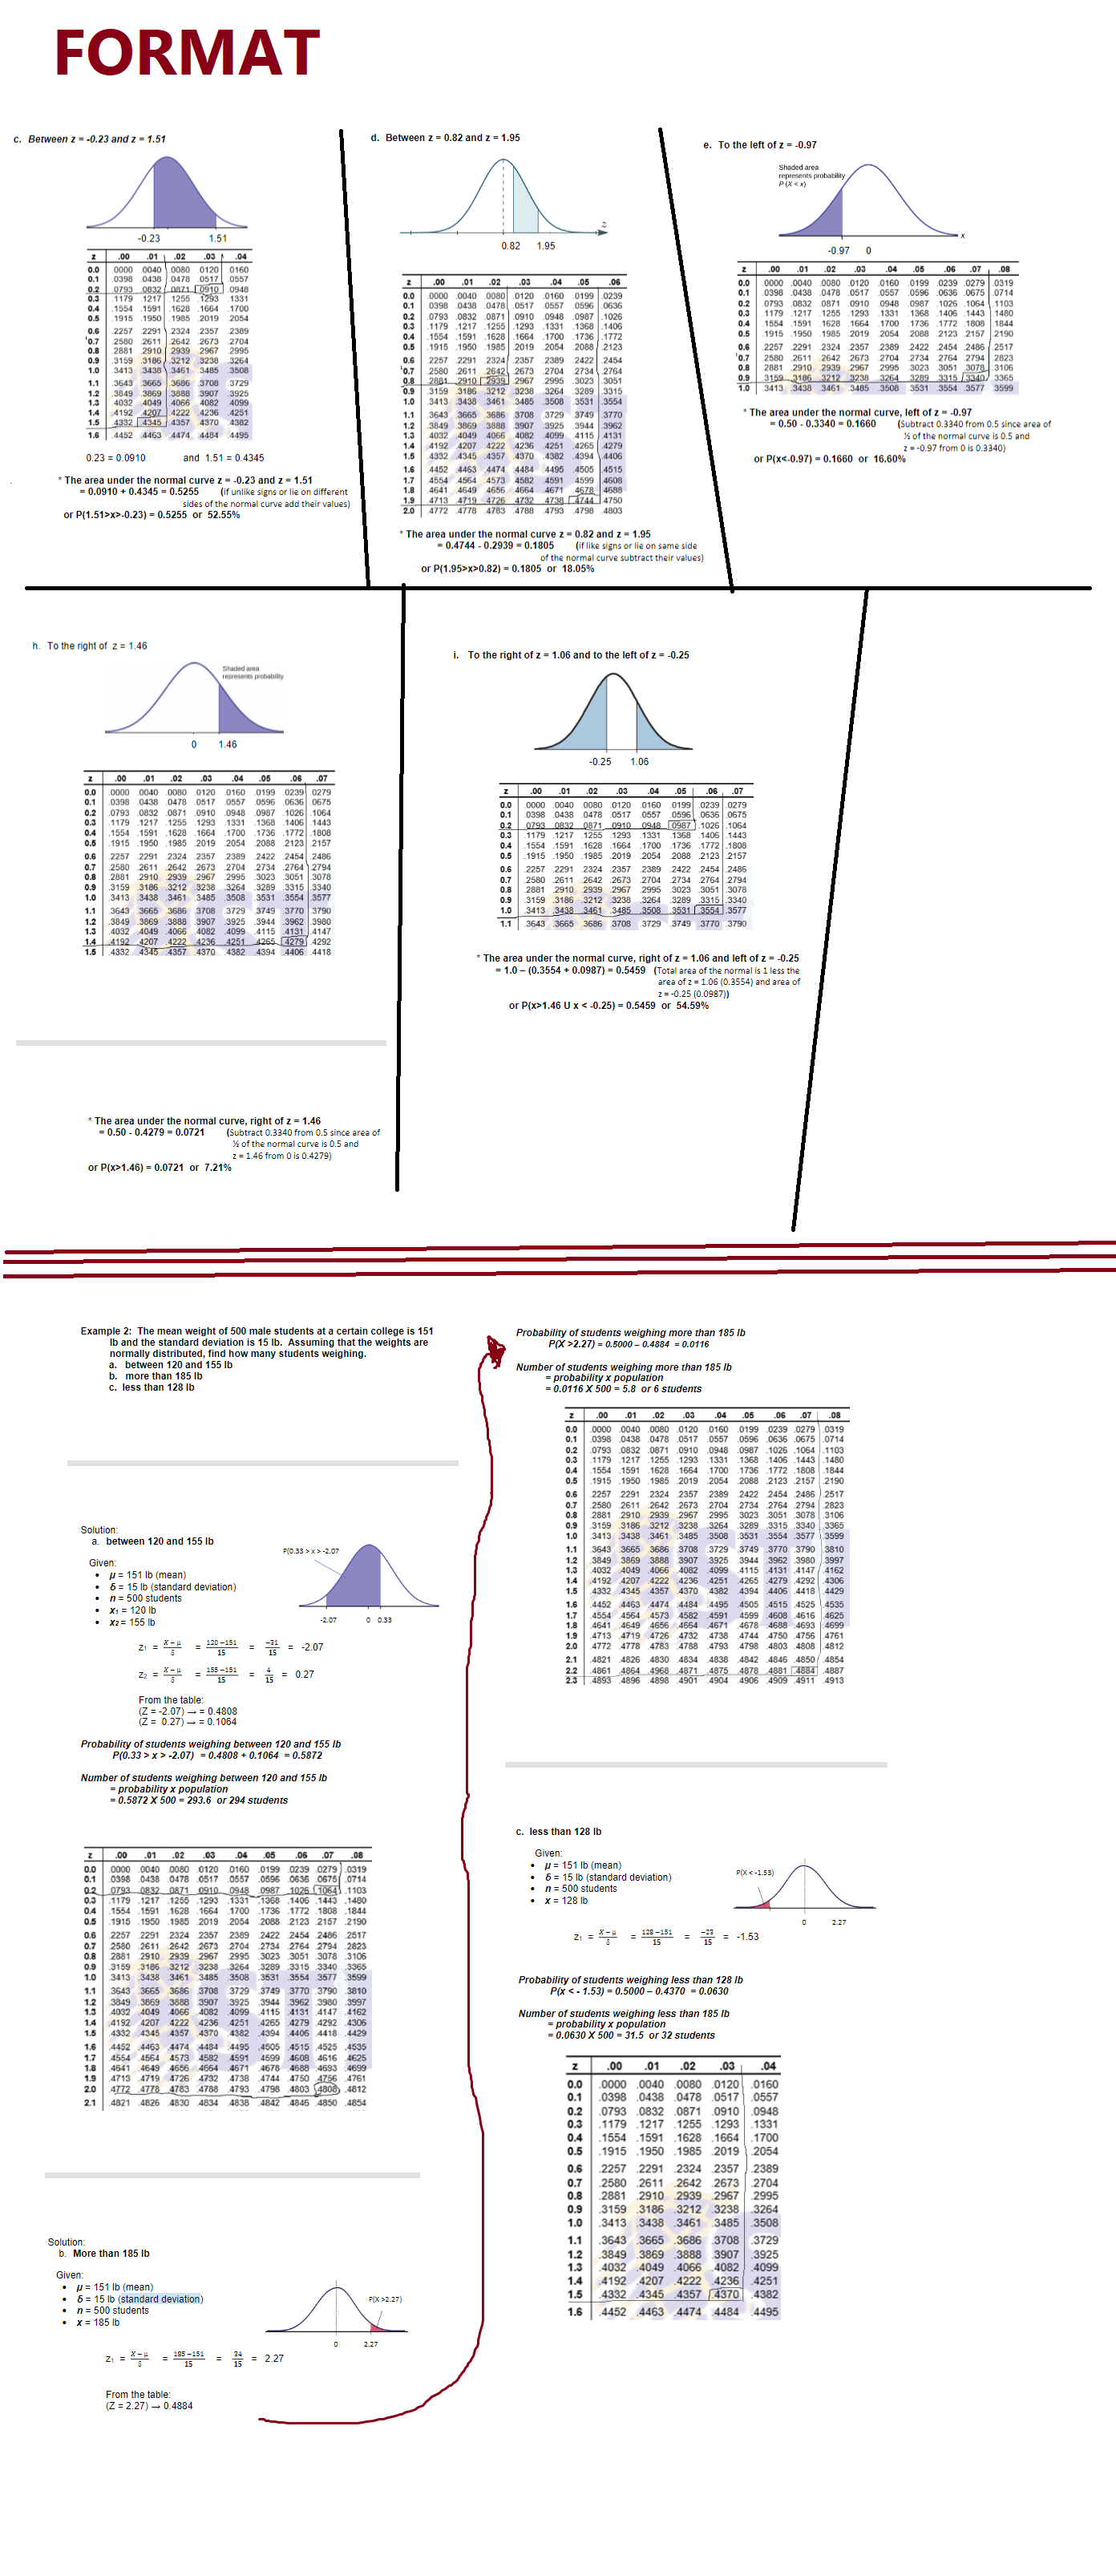
Standard Normal Probabilities Table entry Table entry for z is the area under the standard normal curve to the left of z. 00 01 02 03 .04 05 06 07 08 .09 0.0 .5000 5040 .5080 .5120 .5160 .5199 5239 .5279 .5319 5359 0.1 .5398 .5438 5478 5517 .5557 .5596 .5636 5675 5714 5753 0.2 .5793 .5832 .5871 .5910 .5948 .5987 .6026 .6064 .6103 6141 0.3 .6179 .6217 .6255 .6293 .6331 6368 6406 6443 6480 6517 0.4 .6554 6591 .6628 6664 6700 6736 6772 .6808 .6844 6879 0.5 .6915 6950 .6985 7019 .7054 .7088 .7123 .7157 7190 7224 0.6 .7257 .7291 .7324 7357 .7389 7422 .7454 .7486 .7517 7549 0.7 .7580 .7611 .7642 .7673 .7704 7734 7764 .7794 .7823 .7852 0.8 .7881 7910 7939 .7967 .7995 .8023 .8051 .8078 8106 8133 0.9 .8159 8186 .8212 .8238 .8264 8289 8315 8340 8365 8389 1.0 .8413 .8438 .8461 .8485 .8508 8531 .8554 .8577 .8599 8621 1.1 .8643 8665 .8686 .8708 .8729 8749 .8770 8790 8810 8830 1.2 .8849 8869 .8888 .8907 .8925 8944 8962 .8980 .8997 9015 1.3 .9032 9049 .9066 .9082 .9099 9115 .9131 .9147 9162 .9177 1.4 .9192 .9207 .9222 .9236 .9251 .9265 .9279 .9292 .9306 9319 1.5 .9332 9345 .9357 .9370 .9382 9394 9406 9418 9429 9441 1.6 .9452 .9463 .9474 .9484 .9495 .9505 9515 9525 .9535 .9545 1.7 .9554 .9564 .9573 .9582 .9591 .9599 9608 .9616 .9625 .9633 1.8 .9641 .9649 9656 9664 9671 9678 .9686 .9693 9699 9706 1.9 .9713 9719 9726 .9732 9738 .9744 .9750 9756 9761 9767 2.0 .9772 .9778 .9783 9788 .9793 .9798 .9803 .9808 .9812 .9817 2.1 .9821 9826 .9830 .9834 .9838 9842 .9846 .9850 9854 9857 2.2 .9861 .9864 .9868 .9871 .9875 .9878 9881 .9884 .9887 9890 2.3 .9893 .9896 .9898 .9901 .9904 .9906 9909 9911 .9913 9916 2.4 .9918 .9920 .9922 9925 .9927 9929 9931 9932 9934 9936 2.5 .9938 .9940 .9941 9943 9945 .9946 9948 .9949 9951 .9952 2.6 .9953 9955 .9956 9957 .9959 9960 .9961 .9962 9963 9964 2.7 .9965 9966 .9967 .9968 .9969 9970 .9971 .9972 9973 9974 2.8 .9974 .9975 9976 .9977 .9977 .9978 9979 .9979 .9980 9981 2.9 .9981 .9982 .9982 9983 9984 .9984 9985 9985 9986 9986 3.0 .9987 .9987 .9987 .9988 .9988 9989 .9989 .9989 9990 9990 3.1 .9990 .9991 .9991 .9991 9992 9992 9992 9992 9993 9993 3.2 .9993 9993 .9994 .9994 .9994 .9994 9994 .9995 .9995 9995 3.3 .9995 .9995 9995 9996 9996 9996 9996 9996 9996 9997 3.4 .9997 .9997 .9997 .9997 .9997 9997 9997 .9997 .9997 9998FORMAT C. Between z - -0.23 and z = 1.51 d. Between z = 0.82 and z = 1.95 . To the left of z = -0.97 Shaded area -0.23 1.51 0.82 1.95 -0.97 1700 68:8 8:2828- 2517 3061 30 3531 3553 3 The area under the normal curve, left of z = -0.97 4452 4463 4474 4484 - 0.50 - 0.3340 - 0.1660 (Subtract 0.3340 from 0.5 since area of * of the normal curve is 0.5 and 0.23 = 0.0910 and 1.51 = 0.4345 or P(xx>-0.23) = 0.5255 or 52.55% 4718 4763 4786 4793 4736 4750 * The area under the normal curve z = 0.82 and z = 1.95 of the normal curve all he normal curve subtract their va or P(1.95>x>0.82) = 0.1805 or 18.05% h. To the right of z = 1.46 . To the right of z = 1.06 and to the left of z = -0.25 0 1.46 - 0.25 1.06 # 68898 882828|~| $506 68828 828828 3953 39 3643 3665 3531 3554 .3577 3708 3729 3749 3770 3790 The area under the normal curve, right of z = 1.06 and left of z = -0.25 = 1.0 - (0.3554 + 0.0987) = 0.5459 (Total area of the normal is area of 2 = 1.06 (0.3554) and area of or P(x>1.46 U x 1.46) = 0.0721 or 7.21% Example 2: The mean weight of 500 male students at a certain college is 151 Ib and the standard deviation is 15 lb. Assuming that the e weights are Probability of students weighing more than 185 lb normally distributed, find how m P(X >2.27) = 0.5000 - 0.4884 = 0.0116 b. more than 185 1 Number of students weighing more than 185 lb c. less than 128 lb = probability x population -0.0116 X 500 = 5.8 or 6 students Solution: a. between 120 and 155 lb P(0.33 > > >-2.07 GR 865 606: 60898 8:8898- Given: W= 151 1b (mean) po (standard deviation) . n = 500 students . X1 = 120 1b X2 = 155 lb -2.07 0 0.33 21 = 2-1 = 120-151 = 1 = -2.07 22 = 2- 1 = 158 -151 = 1 = 0.27 From the table: Z =-2.07) - (Z= 0.27) - = 0.1064 Probability of students weighing between 120 and 155 It P(0.33 > > > -2.07) - 0.4808 + 0.1064 - 0.5872 Number of students weighing between 120 and 155 lb = probability x population = 0.5872 X 500 = 293.6 or 294 students C. less than 128 lb Given: . M= 151 lb (mean) . 6 = 15 16 (stan PDX
Step by Step Solution
There are 3 Steps involved in it
Step: 1
Get Instant Access to Expert-Tailored Solutions
See step-by-step solutions with expert insights and AI powered tools for academic success
Step: 2
Step: 3
Ace Your Homework with AI
Get the answers you need in no time with our AI-driven, step-by-step assistance