

Help me. Please solve this above questions using statements given below. I will up-vote you lifetime
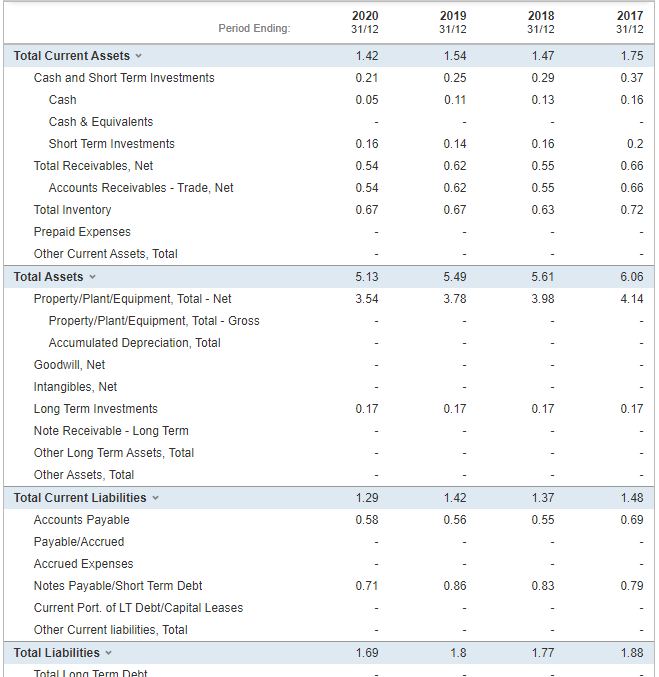
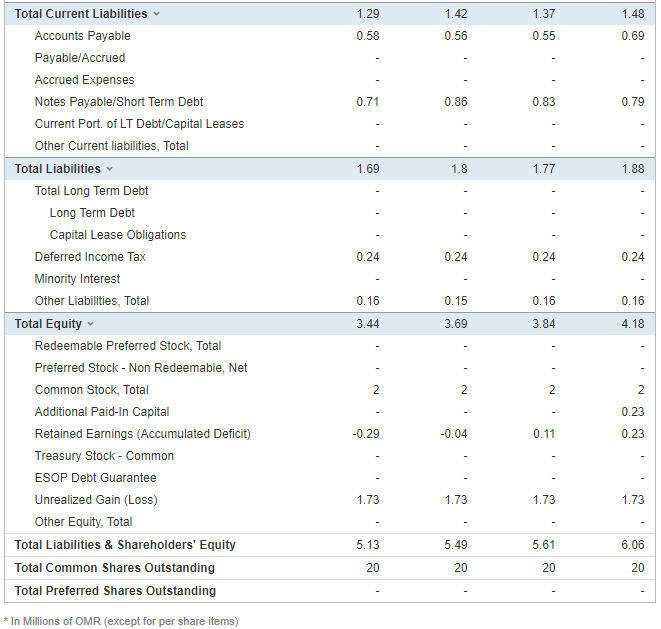
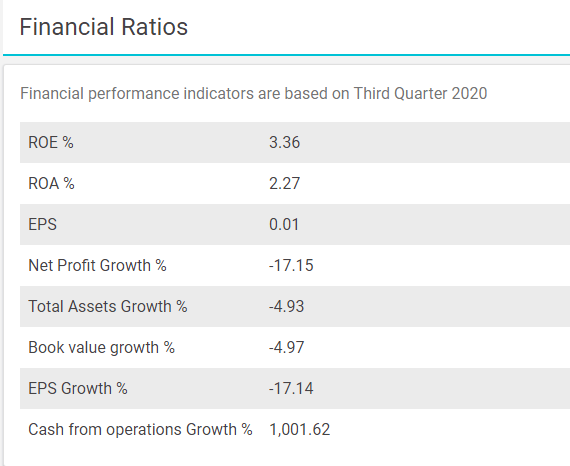
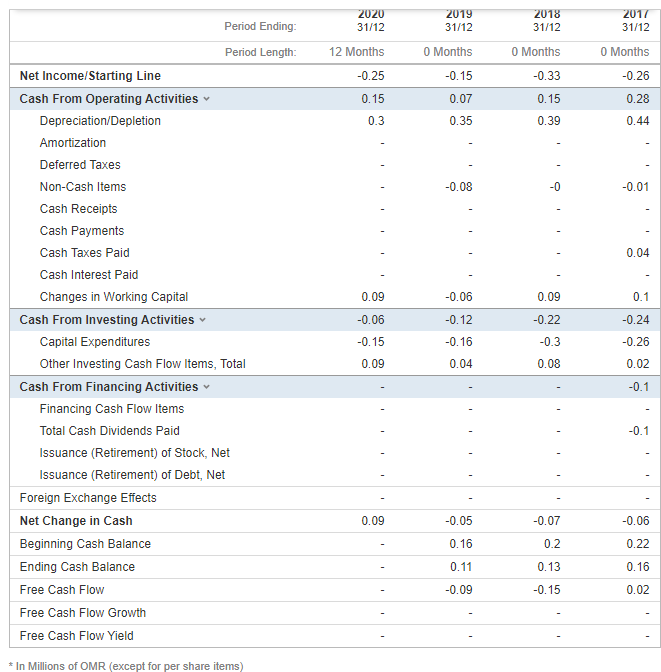
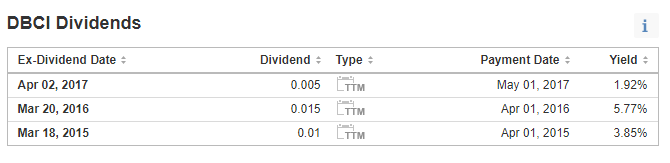
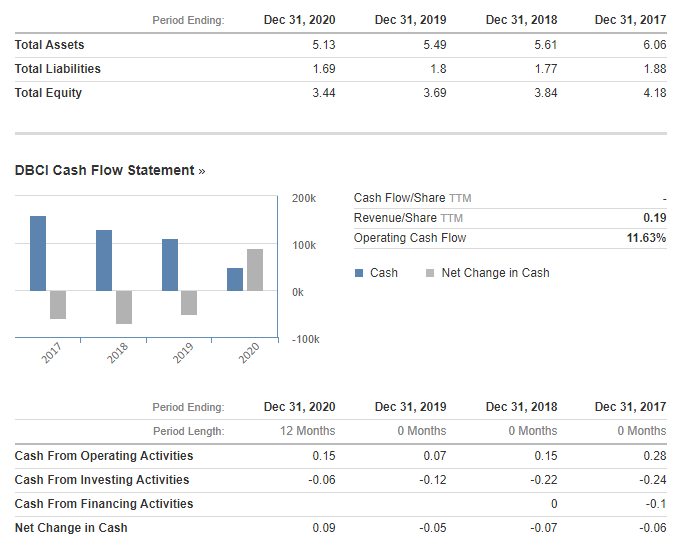
6. Profitability Analysis: a. ROA. b. Profit Margin. Assets Turnover. 7. ROCE Analysis a. ROCE. b. CEL. C. CSL. 8. Risk Analysis: a. Quick Ratio (Acid Test Ratio). b. Working capital Activity ratio. 2020 31/12 2019 31/12 2018 31/12 2017 31/12 1.42 1.54 1.75 1.47 0.29 0.21 0.25 0.37 0.05 0.11 0.13 0.16 0.14 0.2 0.16 0.54 0.16 0.55 0.55 0.62 0.62 0.66 0.54 0.66 0.67 0.67 0.63 0.72 5.49 6.06 5.13 3.54 5.61 3.98 3.78 4.14 Period Ending: Total Current Assets Cash and Short Term Investments Cash Cash & Equivalents Short Term Investments Total Receivables, Net Accounts Receivables - Trade, Net Total Inventory Prepaid Expenses Other Current Assets, Total Total Assets Property/Plant/Equipment, Total - Net Property/Plant/Equipment, Total - Gross Accumulated Depreciation, Total Goodwill, Net Intangibles, Net Long Term Investments Note Receivable - Long Term Other Long Term Assets, Total Other Assets, Total Total Current Liabilities Accounts Payable Payable/Accrued Accrued Expenses Notes Payable/Short Term Debt Current Port of LT Debt/Capital Leases Other Current liabilities, Total Total Liabilities 0.17 0.17 0.17 0.17 1.29 1.42 1.37 1.48 0.58 0.56 0.55 0.69 0.71 0.86 0.83 0.79 1.69 1.8 1.77 1.88 Total Long Term Deht 1.29 1.42 1.37 1.48 0.58 0.56 0.55 0.69 0.71 0.86 0.83 0.79 1.69 1.8 1.77 1.88 0.24 0.24 0.24 0.24 Total Current Liabilities Accounts Payable Payable/Accrued Accrued Expenses Notes Payable/Short Term Debt Current Port of LT Debt/Capital Leases Other Current liabilities, Total Total Liabilities Total Long Term Debt Long Term Debt Capital Lease Obligations Deferred Income Tax Minority Interest Other Liabilities, Total Total Equity Redeemable Preferred Stock, Total Preferred Stock - Non Redeemable, Net Common Stock, Total Additional Paid-In Capital Retained Earnings (Accumulated Deficit) Treasury Stock - Common ESOP Debt Guarantee Unrealized Gain (Loss) Other Equity, Total Total Liabilities & Shareholders' Equity Total Common Shares Outstanding Total Preferred Shares Outstanding 0.16 0.15 0.16 0.16 3.44 3.69 3.84 4.18 2 2 2 2 0.23 -0.29 -0.04 0.11 0.23 1.73 1.73 1.73 1.73 5.13 5.49 5.61 6.06 20 20 20 20 * In Millions of OMR (except for per share items) Financial Ratios Financial performance indicators are based on Third Quarter 2020 ROE % 3.36 ROA % 2.27 EPS 0.01 Net Profit Growth % -17.15 Total Assets Growth % -4.93 Book value growth % -4.97 EPS Growth % -17.14 Cash from operations Growth % 1,001.62 Period Ending: 2020 31/12 2019 31/12 2018 31/12 2017 31/12 12 Months O Months 0 Months 0 Months -0.15 -0.33 -0.26 -0.25 0.15 0.3 0.07 0.28 0.15 0.39 0.35 0.44 -0.08 -0 -0.01 0.04 0.09 -0.06 0.09 0.1 -0.06 -0.22 Period Length: Net Income/Starting Line Cash From Operating Activities Depreciation/Depletion Amortization Deferred Taxes Non-Cash Items Cash Receipts Cash Payments Cash Taxes Paid Cash Interest Paid Changes in Working Capital Cash From Investing Activities Capital Expenditures Other Investing Cash Flow Items, Total Cash From Financing Activities Financing Cash Flow Items Total Cash Dividends Paid Issuance (Retirement) of Stock, Net Issuance (Retirement) of Debt, Net Foreign Exchange Effects Net Change in Cash Beginning Cash Balance Ending Cash Balance Free Cash Flow Free Cash Flow Growth Free Cash Flow Yield -0.12 -0.16 -0.24 -0.26 -0.15 -0.3 0.09 0.04 0.08 0.02 -0.1 -0.1 - - 0.09 -0.05 -0.07 -0.06 0.16 0.2 0.22 0.11 0.13 0.16 -0.09 -0.15 0.02 * In Millions of OMR (except for per share items) DBCI Dividends i Yield 1.92% Ex-Dividend Date Apr 02, 2017 Mar 20, 2016 Mar 18, 2015 Dividend : Type 0.005 LTTM 0.015 CM 0.01 M Payment Date May 01, 2017 Apr 01, 2016 Apr 01, 2015 5.77% 3.85% Period Ending: Dec 31, 2020 Dec 31, 2019 Dec 31, 2017 Dec 31, 2018 5.61 5.13 5.49 6.06 Total Assets Total Liabilities Total Equity 1.69 1.8 1.77 1.88 3.44 3.69 3.84 4.18 DBCI Cash Flow Statement >> 200k Cash Flow/Share TTM Revenue/Share ITM Operating Cash Flow 0.19 11.63% 100K Cash Net Change in Cash OK -100k 2017 2018 2019 2020 Dec 31, 2020 12 Months Dec 31, 2019 O Months Dec 31, 2018 O Months Dec 31, 2017 O Months 0.15 0.07 0.15 0.28 Period Ending: Period Length: Cash From Operating Activities Cash From Investing Activities Cash From Financing Activities Net Change in Cash -0.06 -0.12 -0.22 -0.24 0 -0.1 0.09 -0.05 -0.07 -0.06 6. Profitability Analysis: a. ROA. b. Profit Margin. Assets Turnover. 7. ROCE Analysis a. ROCE. b. CEL. C. CSL. 8. Risk Analysis: a. Quick Ratio (Acid Test Ratio). b. Working capital Activity ratio. 2020 31/12 2019 31/12 2018 31/12 2017 31/12 1.42 1.54 1.75 1.47 0.29 0.21 0.25 0.37 0.05 0.11 0.13 0.16 0.14 0.2 0.16 0.54 0.16 0.55 0.55 0.62 0.62 0.66 0.54 0.66 0.67 0.67 0.63 0.72 5.49 6.06 5.13 3.54 5.61 3.98 3.78 4.14 Period Ending: Total Current Assets Cash and Short Term Investments Cash Cash & Equivalents Short Term Investments Total Receivables, Net Accounts Receivables - Trade, Net Total Inventory Prepaid Expenses Other Current Assets, Total Total Assets Property/Plant/Equipment, Total - Net Property/Plant/Equipment, Total - Gross Accumulated Depreciation, Total Goodwill, Net Intangibles, Net Long Term Investments Note Receivable - Long Term Other Long Term Assets, Total Other Assets, Total Total Current Liabilities Accounts Payable Payable/Accrued Accrued Expenses Notes Payable/Short Term Debt Current Port of LT Debt/Capital Leases Other Current liabilities, Total Total Liabilities 0.17 0.17 0.17 0.17 1.29 1.42 1.37 1.48 0.58 0.56 0.55 0.69 0.71 0.86 0.83 0.79 1.69 1.8 1.77 1.88 Total Long Term Deht 1.29 1.42 1.37 1.48 0.58 0.56 0.55 0.69 0.71 0.86 0.83 0.79 1.69 1.8 1.77 1.88 0.24 0.24 0.24 0.24 Total Current Liabilities Accounts Payable Payable/Accrued Accrued Expenses Notes Payable/Short Term Debt Current Port of LT Debt/Capital Leases Other Current liabilities, Total Total Liabilities Total Long Term Debt Long Term Debt Capital Lease Obligations Deferred Income Tax Minority Interest Other Liabilities, Total Total Equity Redeemable Preferred Stock, Total Preferred Stock - Non Redeemable, Net Common Stock, Total Additional Paid-In Capital Retained Earnings (Accumulated Deficit) Treasury Stock - Common ESOP Debt Guarantee Unrealized Gain (Loss) Other Equity, Total Total Liabilities & Shareholders' Equity Total Common Shares Outstanding Total Preferred Shares Outstanding 0.16 0.15 0.16 0.16 3.44 3.69 3.84 4.18 2 2 2 2 0.23 -0.29 -0.04 0.11 0.23 1.73 1.73 1.73 1.73 5.13 5.49 5.61 6.06 20 20 20 20 * In Millions of OMR (except for per share items) Financial Ratios Financial performance indicators are based on Third Quarter 2020 ROE % 3.36 ROA % 2.27 EPS 0.01 Net Profit Growth % -17.15 Total Assets Growth % -4.93 Book value growth % -4.97 EPS Growth % -17.14 Cash from operations Growth % 1,001.62 Period Ending: 2020 31/12 2019 31/12 2018 31/12 2017 31/12 12 Months O Months 0 Months 0 Months -0.15 -0.33 -0.26 -0.25 0.15 0.3 0.07 0.28 0.15 0.39 0.35 0.44 -0.08 -0 -0.01 0.04 0.09 -0.06 0.09 0.1 -0.06 -0.22 Period Length: Net Income/Starting Line Cash From Operating Activities Depreciation/Depletion Amortization Deferred Taxes Non-Cash Items Cash Receipts Cash Payments Cash Taxes Paid Cash Interest Paid Changes in Working Capital Cash From Investing Activities Capital Expenditures Other Investing Cash Flow Items, Total Cash From Financing Activities Financing Cash Flow Items Total Cash Dividends Paid Issuance (Retirement) of Stock, Net Issuance (Retirement) of Debt, Net Foreign Exchange Effects Net Change in Cash Beginning Cash Balance Ending Cash Balance Free Cash Flow Free Cash Flow Growth Free Cash Flow Yield -0.12 -0.16 -0.24 -0.26 -0.15 -0.3 0.09 0.04 0.08 0.02 -0.1 -0.1 - - 0.09 -0.05 -0.07 -0.06 0.16 0.2 0.22 0.11 0.13 0.16 -0.09 -0.15 0.02 * In Millions of OMR (except for per share items) DBCI Dividends i Yield 1.92% Ex-Dividend Date Apr 02, 2017 Mar 20, 2016 Mar 18, 2015 Dividend : Type 0.005 LTTM 0.015 CM 0.01 M Payment Date May 01, 2017 Apr 01, 2016 Apr 01, 2015 5.77% 3.85% Period Ending: Dec 31, 2020 Dec 31, 2019 Dec 31, 2017 Dec 31, 2018 5.61 5.13 5.49 6.06 Total Assets Total Liabilities Total Equity 1.69 1.8 1.77 1.88 3.44 3.69 3.84 4.18 DBCI Cash Flow Statement >> 200k Cash Flow/Share TTM Revenue/Share ITM Operating Cash Flow 0.19 11.63% 100K Cash Net Change in Cash OK -100k 2017 2018 2019 2020 Dec 31, 2020 12 Months Dec 31, 2019 O Months Dec 31, 2018 O Months Dec 31, 2017 O Months 0.15 0.07 0.15 0.28 Period Ending: Period Length: Cash From Operating Activities Cash From Investing Activities Cash From Financing Activities Net Change in Cash -0.06 -0.12 -0.22 -0.24 0 -0.1 0.09 -0.05 -0.07 -0.06