help me question 1

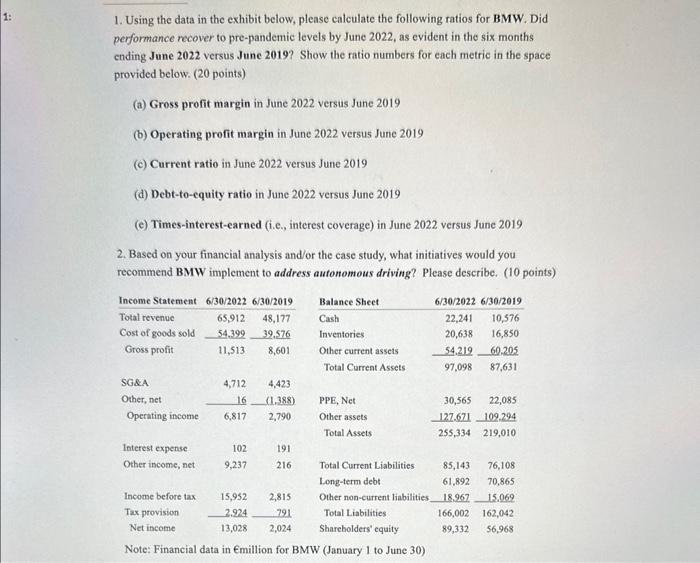
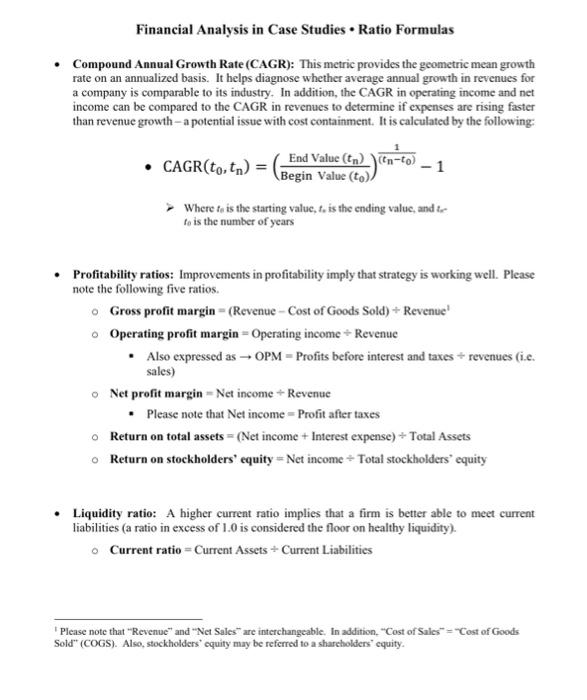
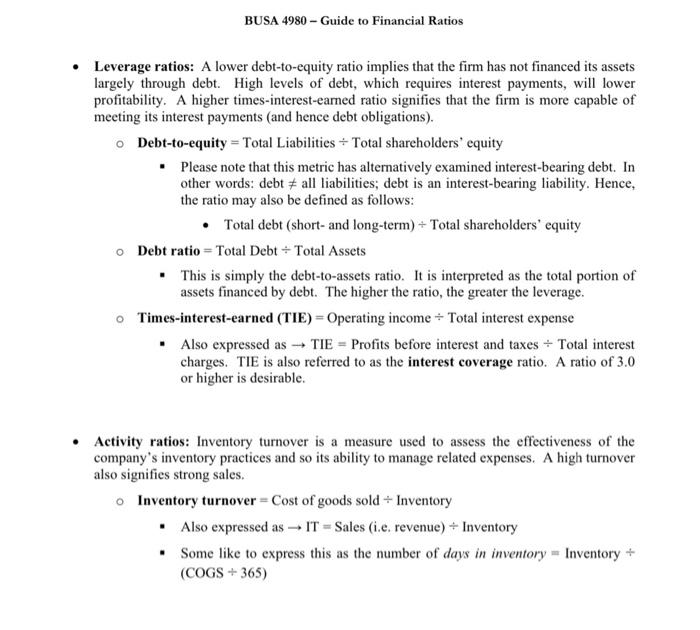
1. Using the data in the exhibit below, please calculate the following ratios for BMW. Did performance recover to pre-pandemic levels by June 2022, as evident in the six months ending June 2022 versus June 2019? Show the ratio numbers for each metric in the space provided below. ( 20 points) (a) Gross profit margin in June 2022 versus June 2019 (b) Operating profit margin in June 2022 versus June 2019 (c) Current ratio in June 2022 versus June 2019 (d) Debt-to-equity ratio in June 2022 versus June 2019 (e) Times-interest-earned (i.e., interest coverage) in June 2022 versus June 2019 2. Based on your financial analysis and/or the case study, what initiatives would you recommend BMW implement to address autonomous driving? Please describe. (10 points) Note: Financial data in Emillion for BMW (January 1 to June 30) Financial Analysis in Case Studies - Ratio Formulas - Compound Annual Growth Rate (CAGR): This metric provides the geometric mean growth rate on an annualized basis. It helps diagnose whether average annual growth in revenues for a company is comparable to its industry. In addition, the CAGR in operating income and net income can be compared to the CAGR in revenues to determine if expenses are rising faster than revenue growth - a potential issue with cost containment. It is calculated by the following: - CAGR(t0,tn)=(BeginValue(t0)EndValue(tn))(tnt0)11 Where tn is the starting value, t0 is the ending valuc, and t0 t0 is the number of years - Profitability ratios: Improvements in profitability imply that strategy is working well. Please note the following five ratios. Gross profit margin =( Revenue - Cost of Goods Sold ) Revenue Operating profit margin = Operating income Revenue - Also expressed as OPM = Profits before interest and taxes revenues (i.e. sales) Net profit margin = Net income Revenue - Please note that Net income = Profit after taxes Return on total assets =( Net income + Interest expense ) Total Assets Return on stockholders' equity = Net income Total stockholders' equity - Liquidity ratio: A higher current ratio implies that a firm is better able to meet current liabilities (a ratio in excess of 1.0 is considered the floor on healthy liquidity). Current ratio = Current Assets Current Liabilities 'Please note that "Revenue" and "Net Sales" are interchangeable. In addition, "Cost of Sales" = -Cost of Goods Sold" (COGS). Also, stockholders' cquity may be referred to a sharebolders' equity. BUSA 4980 - Guide to Financial Ratios Leverage ratios: A lower debt-to-equity ratio implies that the firm has not financed its assets largely through debt. High levels of debt, which requires interest payments, will lower profitability. A higher times-interest-earned ratio signifies that the firm is more capable of meeting its interest payments (and hence debt obligations). Debt-to-equity = Total Liabilities Total shareholders' equity - Please note that this metric has alternatively examined interest-bearing debt. In other words: debt = all liabilities; debt is an interest-bearing liability. Hence, the ratio may also be defined as follows: - Total debt (short- and long-term) Total shareholders' equity Debt ratio = Total Debt Total Assets - This is simply the debt-to-assets ratio. It is interpreted as the total portion of assets financed by debt. The higher the ratio, the greater the leverage. Times-interest-earned (TIE) = Operating income Total interest expense - Also expressed as TIE = Profits before interest and taxes Total interest charges. TIE is also referred to as the interest coverage ratio. A ratio of 3.0 or higher is desirable. Activity ratios: Inventory turnover is a measure used to assess the effectiveness of the company's inventory practices and so its ability to manage related expenses. A high turnover also signifies strong sales. Inventory turnover = Cost of goods sold Inventory - Also expressed as IT= Sales (i.e. revenue) Inventory - Some like to express this as the number of days in inventory = Inventory (COGS365)


