

Answered step by step
Verified Expert Solution
Question
1 Approved Answer
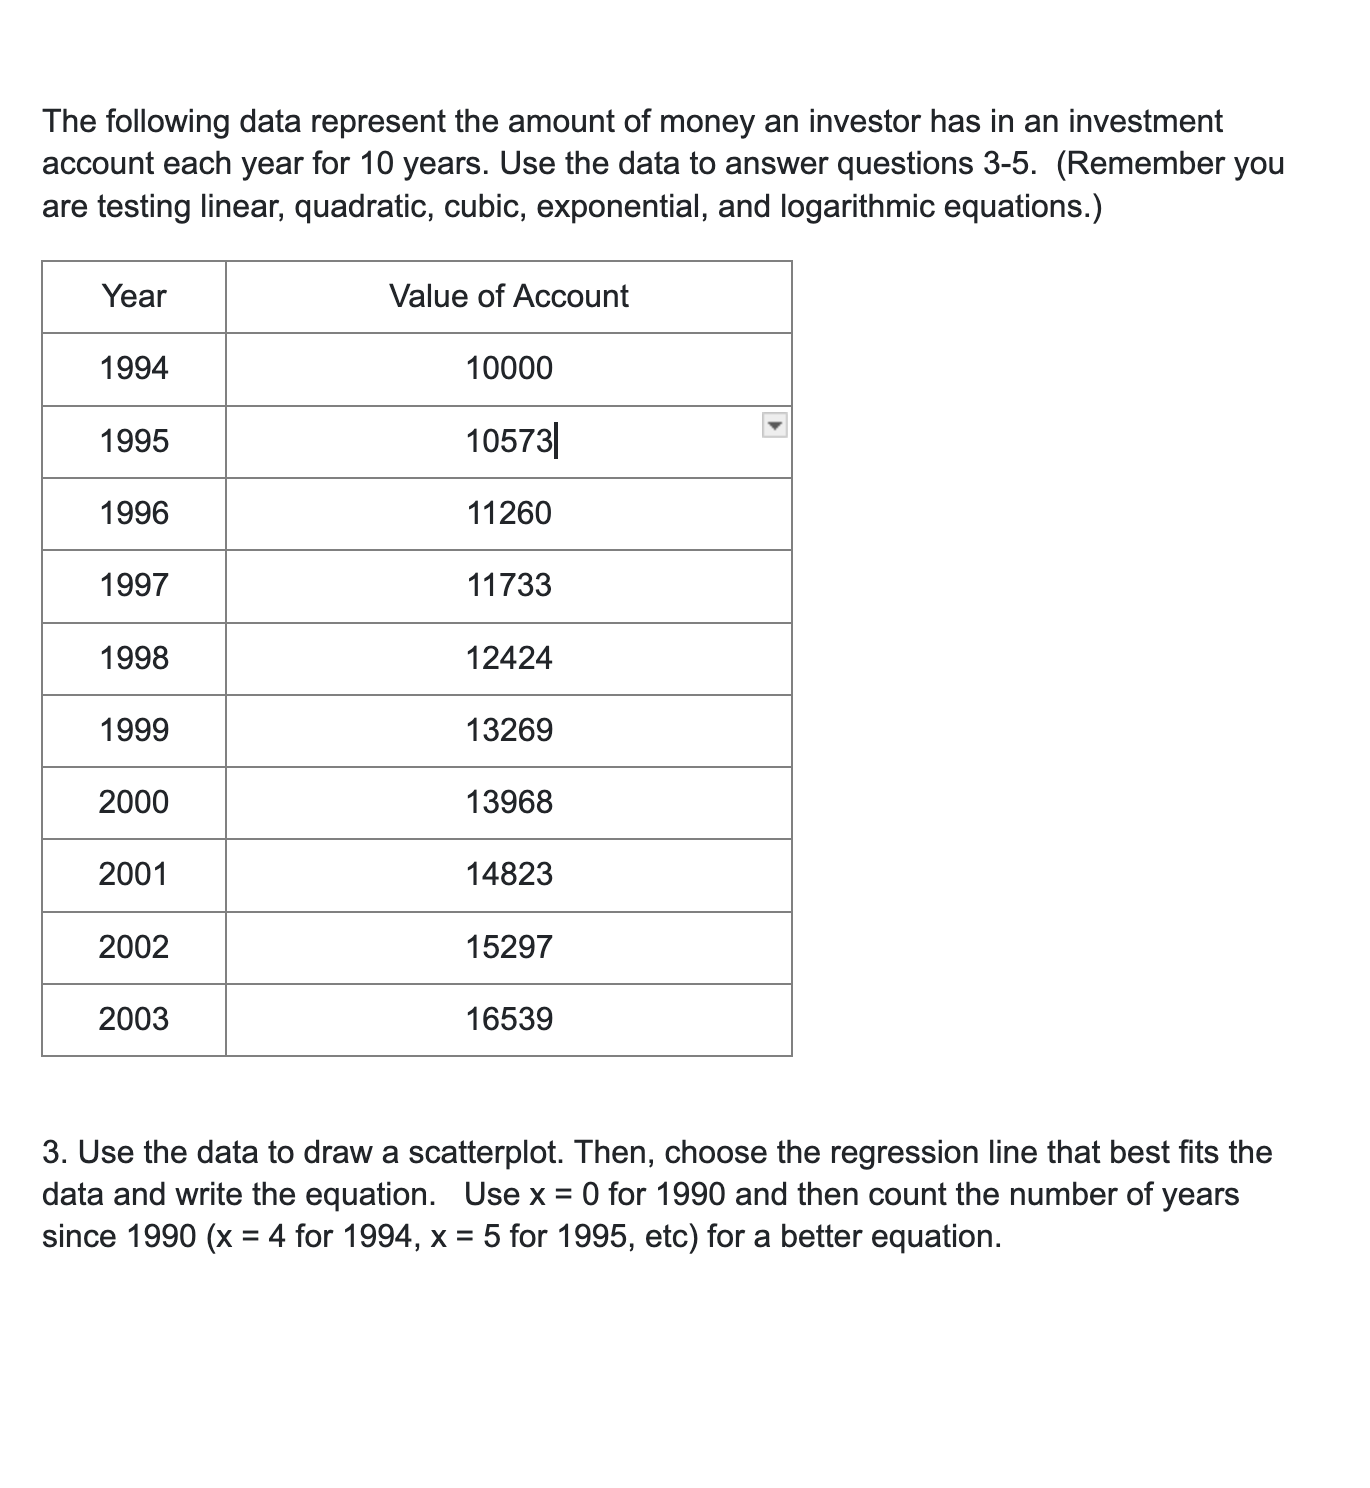
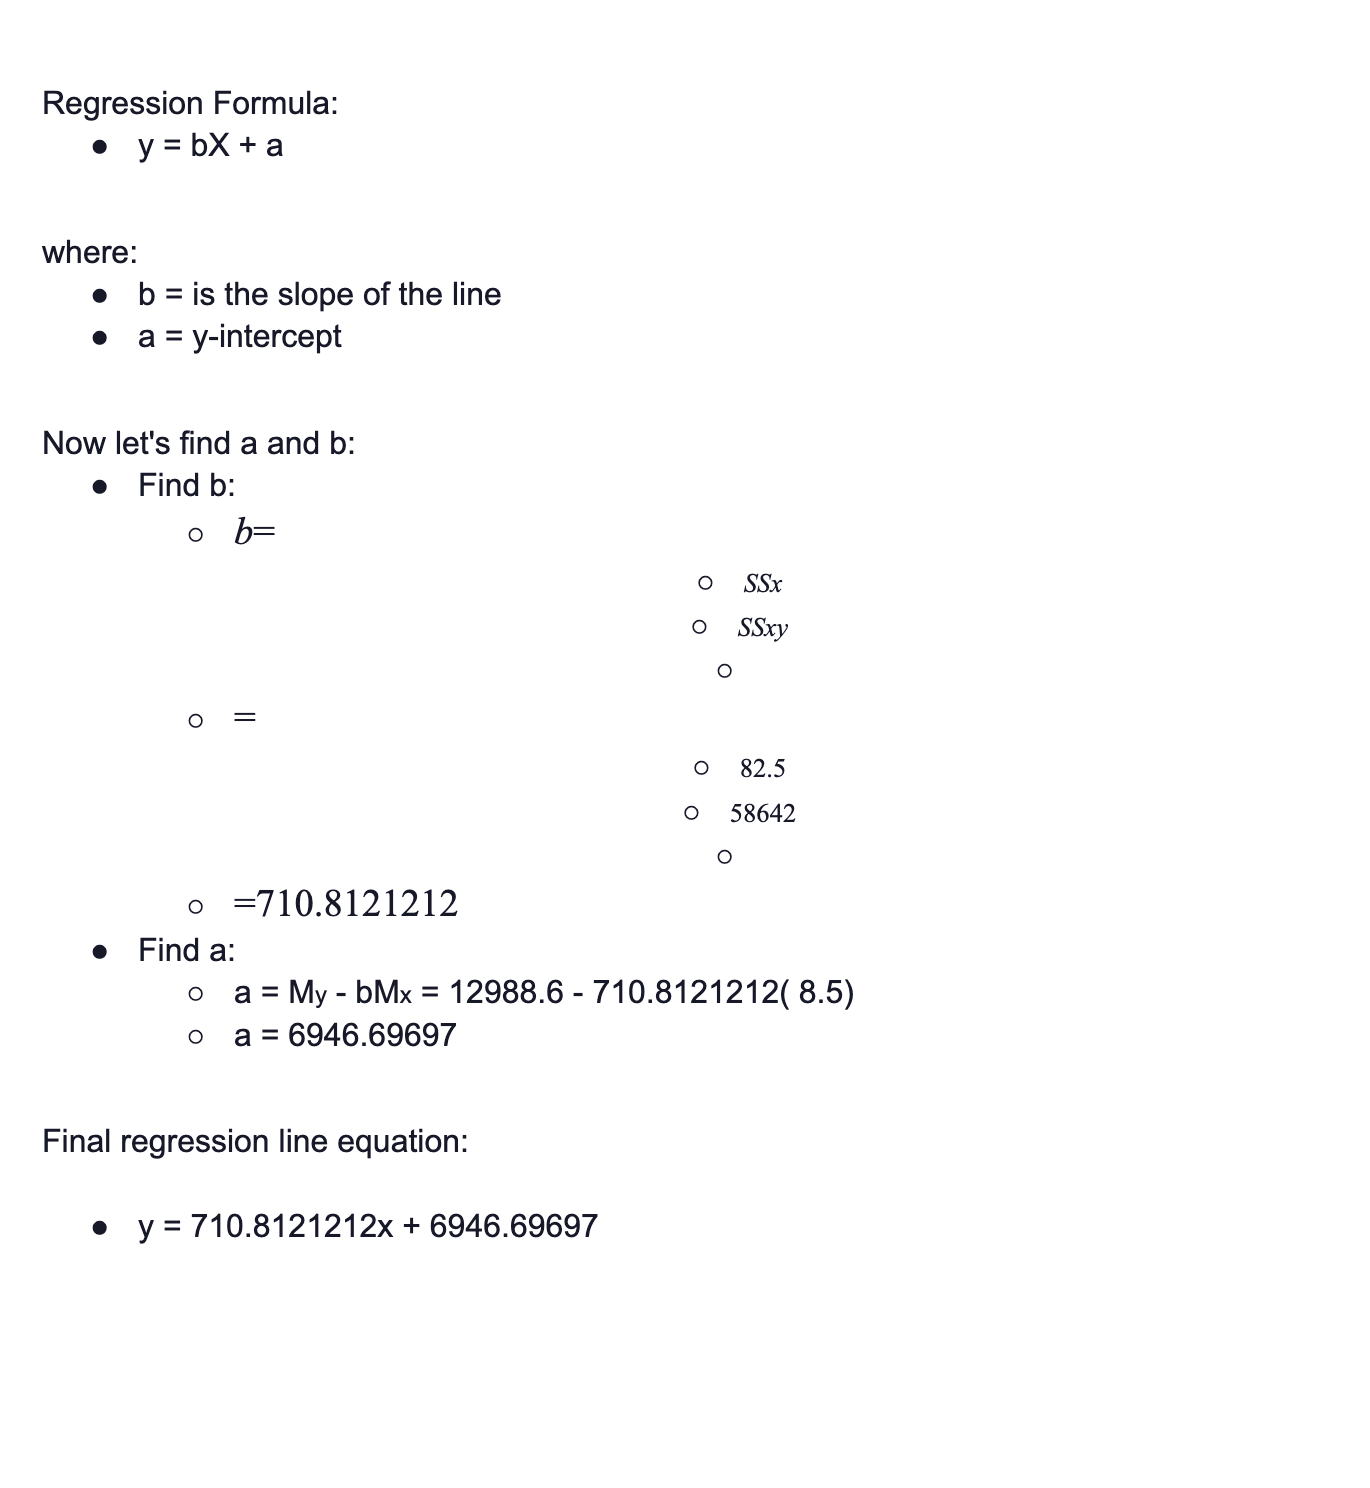
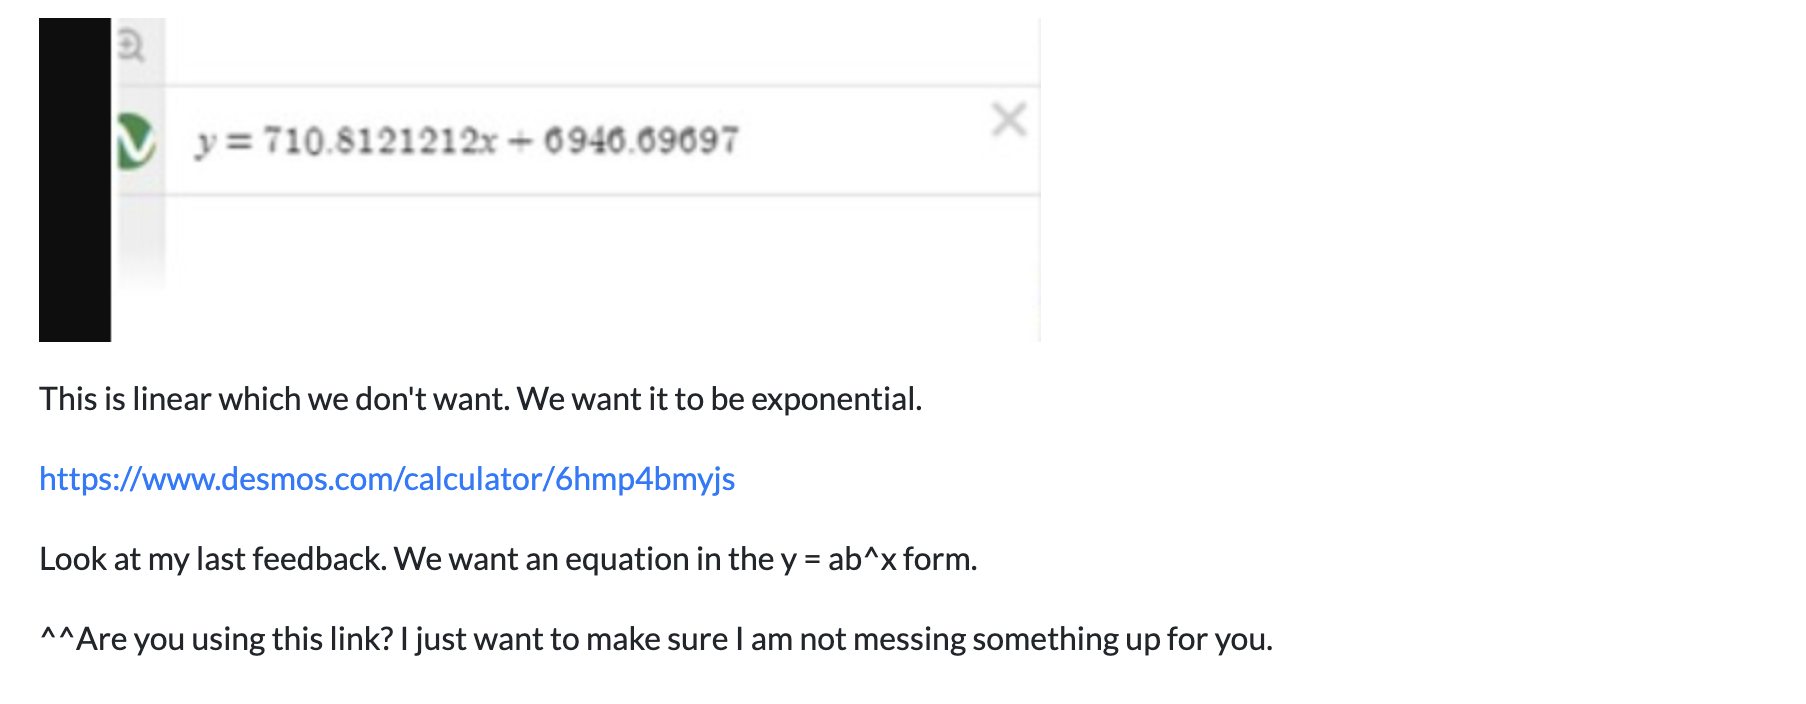
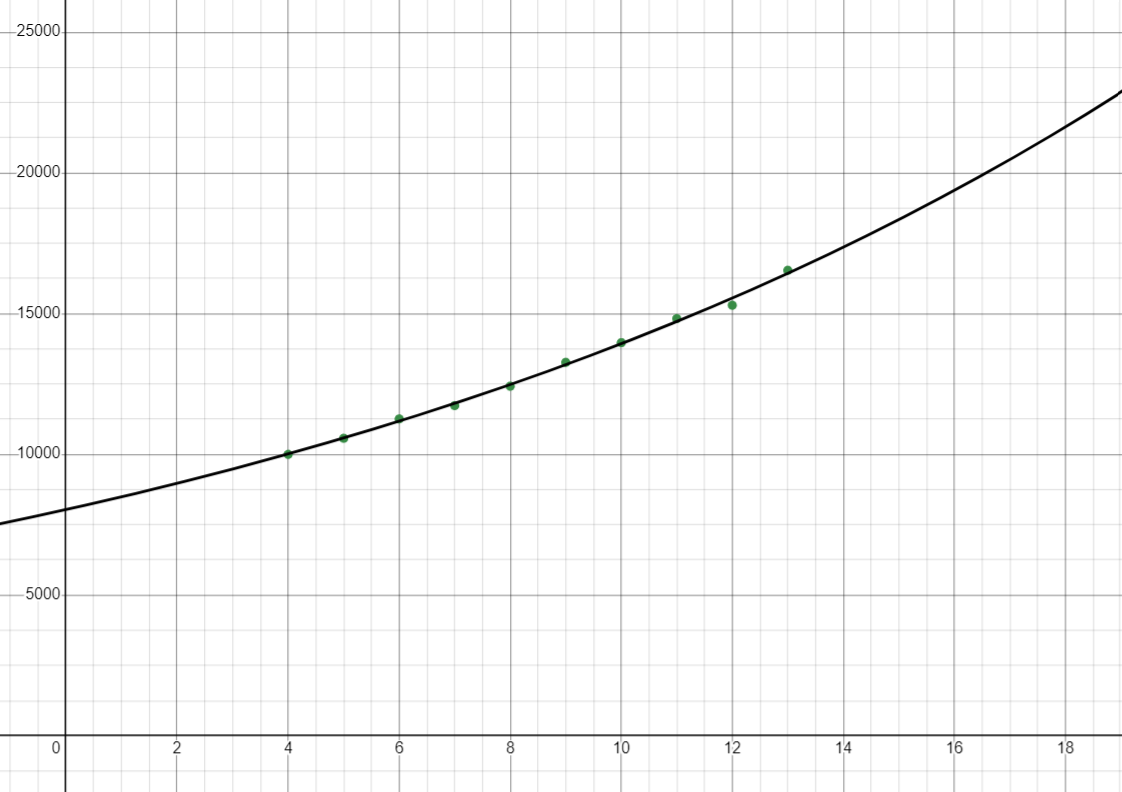
help me revise question 3 The following data represent the amount of money an investor has in an investment account each year for 10 years.
help me revise question 3
Step by Step Solution
There are 3 Steps involved in it
Step: 1

Get Instant Access to Expert-Tailored Solutions
See step-by-step solutions with expert insights and AI powered tools for academic success
Step: 2

Step: 3
Ace Your Homework with AI
Get the answers you need in no time with our AI-driven, step-by-step assistance
Get Started
Complex Variables and Applications
Authors: James Brown, Ruel Churchill
8th edition
73051942, 978-0073051949