

Question
Help me with Statistics please. I really need this to pass my course for the last time------ Project Overview: The purpose of the project is
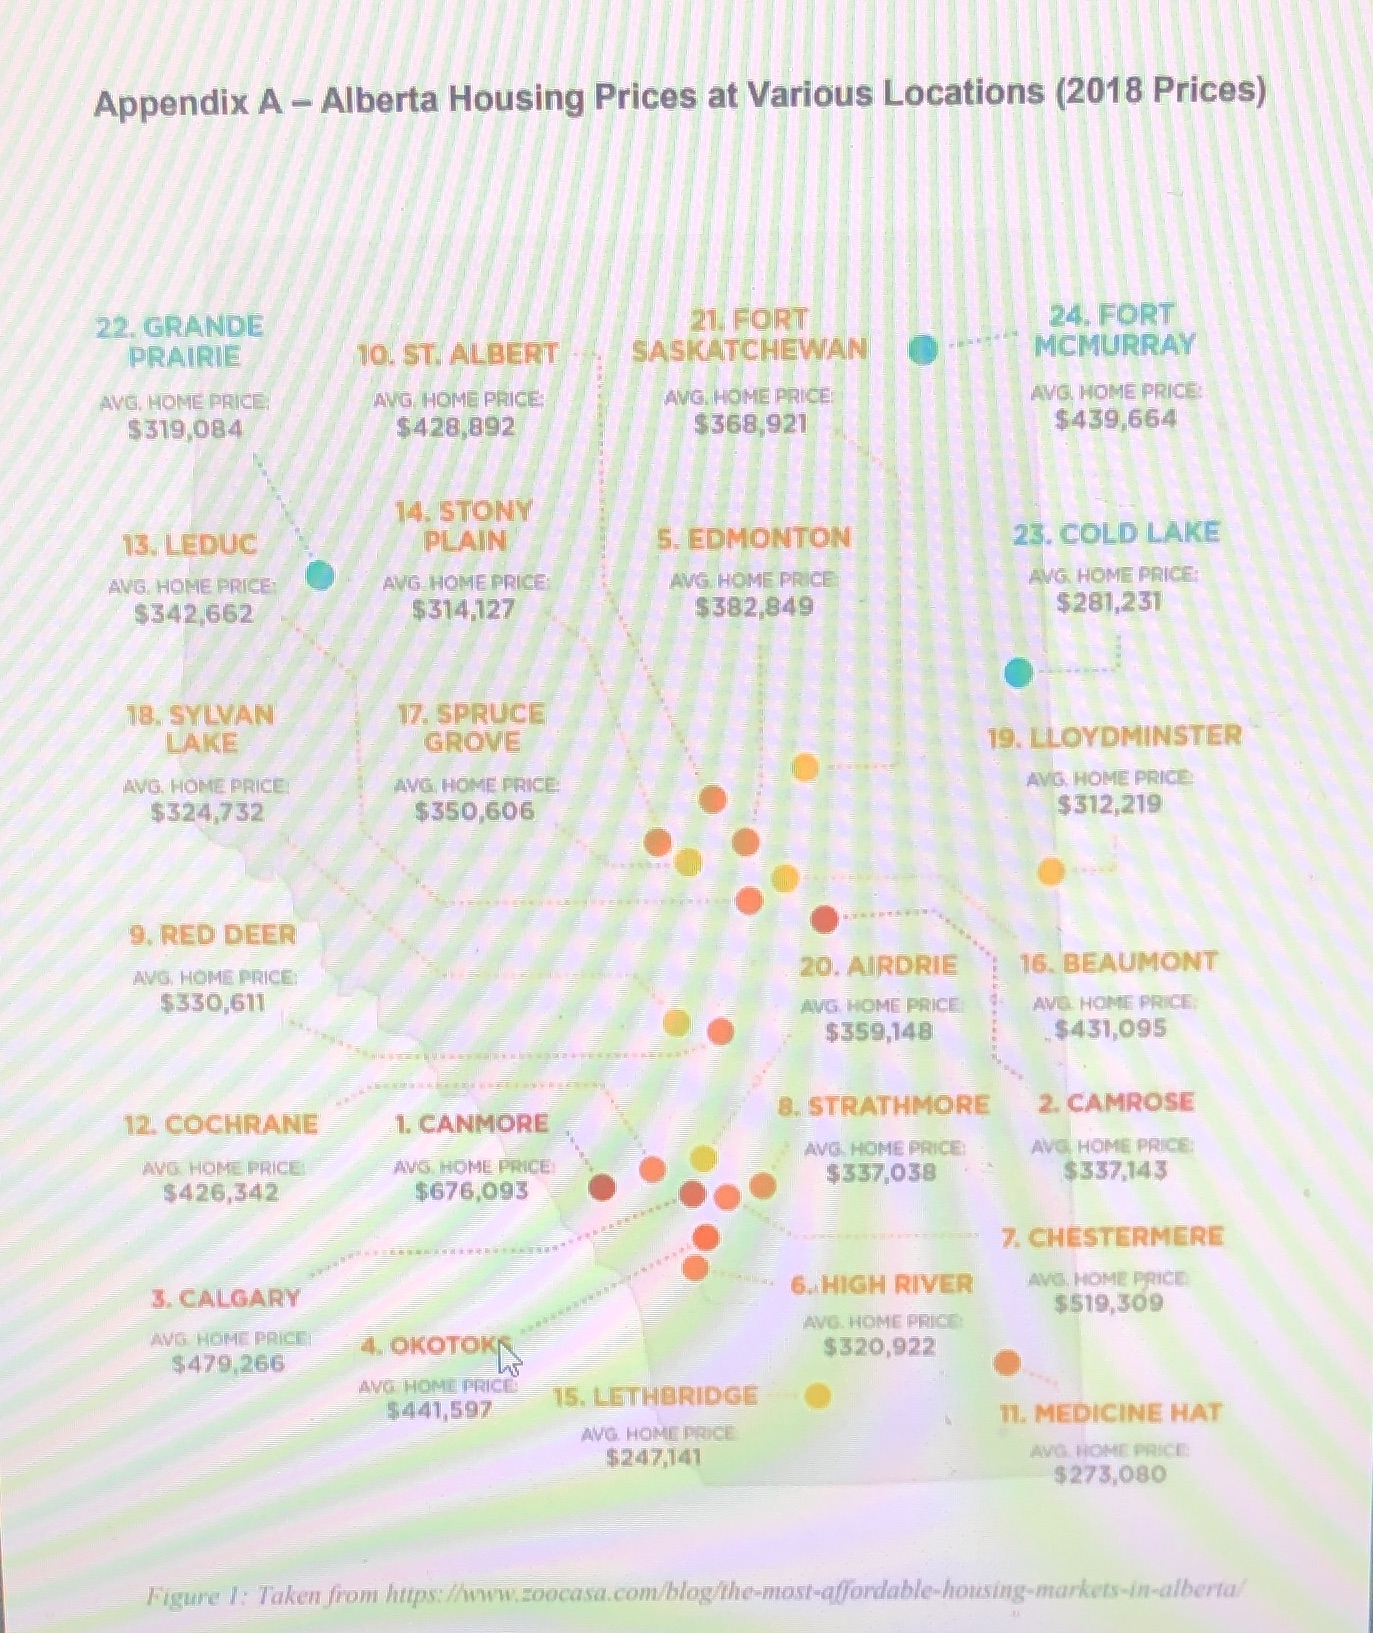
Help me with Statistics please. I really need this to pass my course for the last time------ Project Overview: The purpose of the project is to analyze a real-life set of statistics related to the Alberta housing market and connect that analysis to the concepts learned in Math 20-2. Objectives: ? Design a histogram from a set of housing market data. ? Calculate measures of central tendency and standard deviation of the market data. ? Design a normal distribution curve based on the market data. ? Respond to questions that analyze the market data. Instructions: 1. The preparation of graphs, number calculations and data analysis is related to the map of Alberta housing prices located towards the end of this project on Appendix A. Read over this graphic. 2. Create a frequency table and histogram that relates to the number of locations (the y-axis variable) that have housing prices between dollar values (the x-axis variable). For the x-axis values, group the housing prices into the following: ? $200,000 to $300,000 ? $300,000 to $400,000 ? $400,000 to $500,000 ? $500,000 to $600,000 ? $600,000 to $700,000 3. Using the frequency table values (For L1 use the average of the housing prices in each range. i.e. For the $200,000 to $300,000 range use $250,000), determine the following: ? Mean ? Median ? Mode ? Standard Deviation 4. Using the mean and standard deviation values that you determined in Instruction #3, design a normal distribution curve. The numbers you use in the design of the curve can be rounded to the nearest ten thousand. 5. Select one location below the mean and determine the percentage of houses in these locations that are less expensive. 6. Select one of the locations that is larger than the mean and determine the percentage of housing that is between this location and the mean. 7. Answer the following questions: ? Which of the measures of central tendency are most helpful for potential homeowners? ? Are there any outliers in this data? If so, why do you think the data is/are outliers? ? Are there other statistical data important for potential home buyers looking to move within the boundaries of Alberta?-----Here's the image of Appendix A from instruction 1. Hope you can help me :(
Step by Step Solution
There are 3 Steps involved in it
Step: 1

Get Instant Access to Expert-Tailored Solutions
See step-by-step solutions with expert insights and AI powered tools for academic success
Step: 2

Step: 3
Ace Your Homework with AI
Get the answers you need in no time with our AI-driven, step-by-step assistance
Get Started
Theory And Applications Of Partial Functional Differential Equations
Authors: Abrar A Khan
1st Edition
9353141915, 9789353141912