Answered step by step
Verified Expert Solution
Question
1 Approved Answer
Help me write a Matlab code PLOTTING IN MATLAB For this challenge we will plot experimental and theoretical data on the same plot. Theoretical data
Help me write a Matlab code 
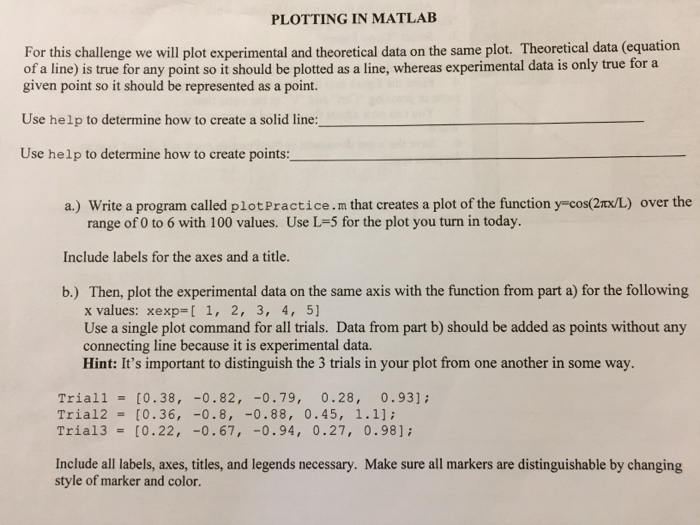
PLOTTING IN MATLAB For this challenge we will plot experimental and theoretical data on the same plot. Theoretical data (equation of a line) is true for any point so it should be plotted as a line, whereas experimental data is only true for a given point so it should be represented as a point. Use help to determine how to create a solid line: Use help to determine how to create points: a.) Write a program called plotPractice.m that creates a plot of the function y-cos(2Tx/L) over the range of 0 to 6 with 100 values. Use L=5 for the plot you turn in today. Include labels for the axes and a title b.) Then, plot the experimental data on the same axis with the function from part a) for the following x values: xexp [ 1, 2, 3, 4, 5] Use a single plot command for all trials. connecting line because it is experimental data. Hint: It's important to distinguish the 3 trials in your plot from one another in some way. Data from part b) should be added as points without any Trial! Trial2 Tria!3 = = = [0.38, [0.36, [0.22, -0.82,-0.79, 0.28, 0.93); -0.8, -0.88, 0.45, 1.1); -0.67, -0.94, 0.27, 0.98); Include all labels, axes, titles, and legends necessary. Make sure all markers are distinguishable by changing style of marker and color 
Step by Step Solution
There are 3 Steps involved in it
Step: 1

Get Instant Access to Expert-Tailored Solutions
See step-by-step solutions with expert insights and AI powered tools for academic success
Step: 2

Step: 3

Ace Your Homework with AI
Get the answers you need in no time with our AI-driven, step-by-step assistance
Get Started


