help please
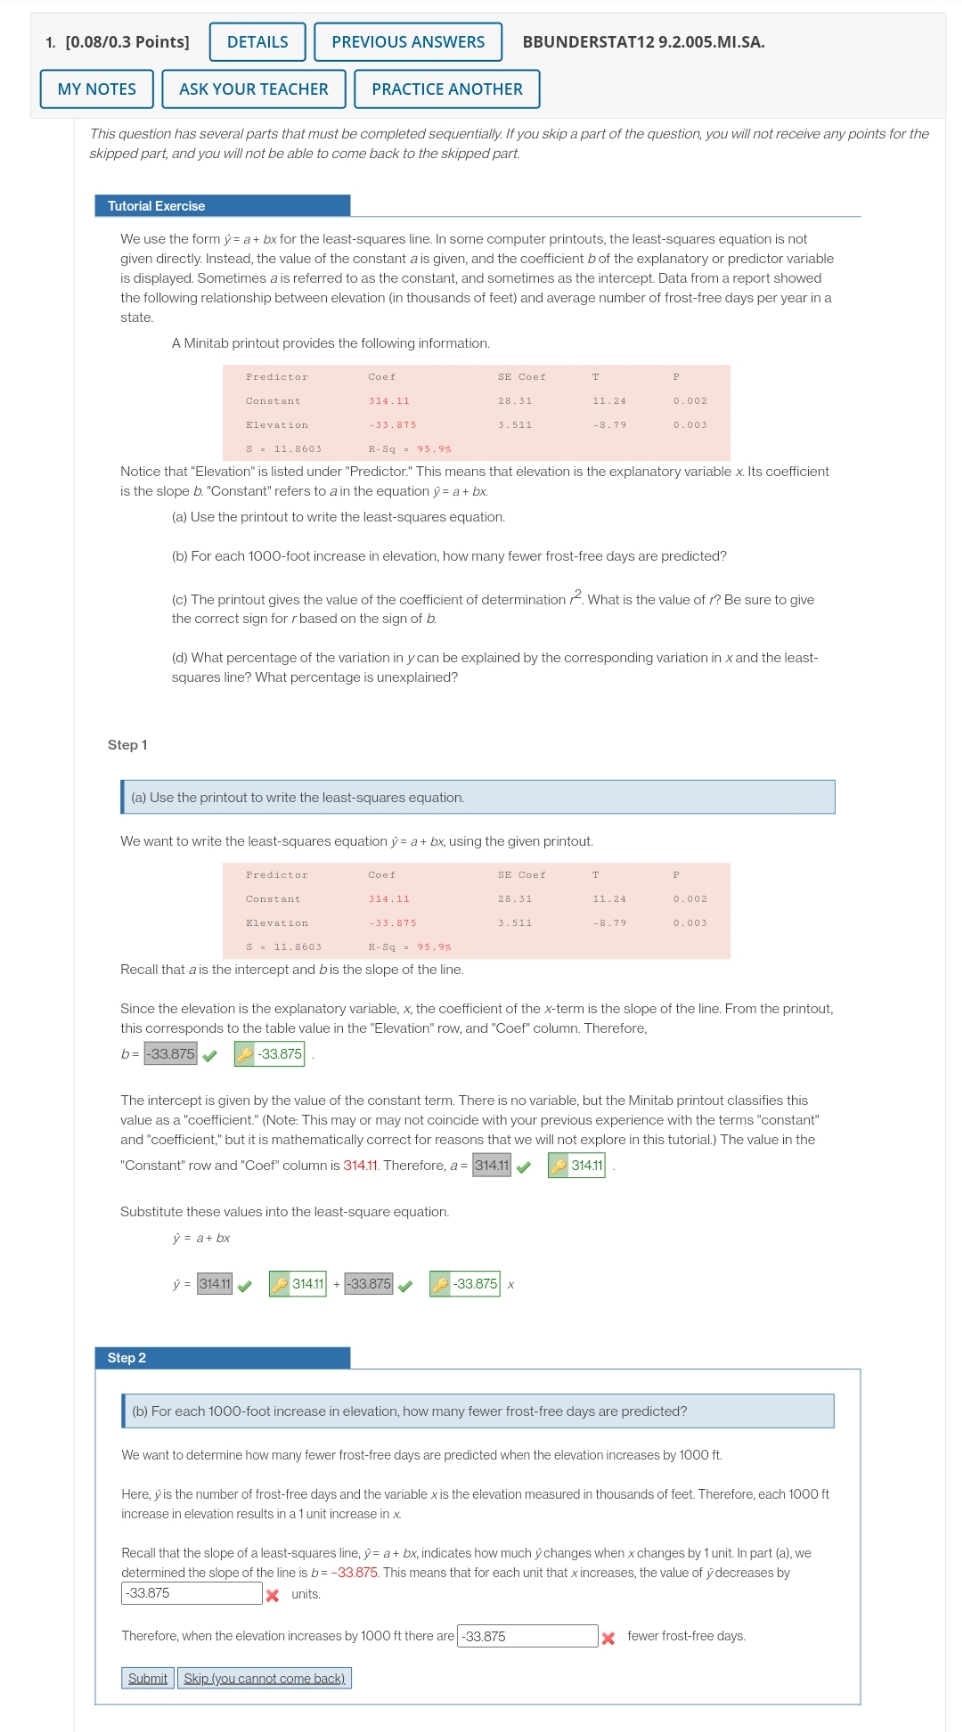
1. [0.08/0.3 Points] DETAILS PREVIOUS ANSWERS BBUNDERSTAT12 9.2.005.MI.SA. MY NOTES ASK YOUR TEACHER PRACTICE ANOTHER This question has several parts that must be completed sequentially. If you skip a part of the question, you will not receive any points for the skipped part, and you will not be able to come back to the skipped part. Tutorial Exercise We use the form y = a + bx for the least-squares line. In some computer printouts, the least-squares equation is not given directly. Instead, the value of the constant a is given, and the coefficient b of the explanatory or predictor variable is displayed. Sometimes a is referred to as the constant, and sometimes as the intercept. Data from a report showed the following relationship between elevation (in thousands of feet) and average number of frost-free days per year in a state A Minitab printout provides the following information. Predictor Coef SE Coel Constant 314 . 11 28. 31 11 . 24 0 . 002 Elevation - 33. 875 3 . 511 8. 79 D. 003 s = 11. 8603 R- Sq = 95.9% Notice that "Elevation" is listed under "Predictor." This means that elevation is the explanatory variable x. Its coefficient is the slope b. "Constant" refers to a in the equation y = a + bx (a) Use the printout to write the least-squares equation. (b) For each 1000-foot increase in elevation, how many fewer frost-free days are predicted? (c) The printout gives the value of the coefficient of determination /. What is the value of /? Be sure to give the correct sign for rbased on the sign of b. (d) What percentage of the variation in y can be explained by the corresponding variation in x and the least- squares line? What percentage is unexplained? Step 1 (a) Use the printout to write the least-squares equation. We want to write the least-squares equation y = a + bx, using the given printout. Predictor Coef SE Coel P Constant 314 . 11 28.31 11 . 24 0 . 002 Elevation - 33. 875 3 . 511 - 8. 79 0. 003 s = 11. 8603 R- Sq = 95.9% Recall that a is the intercept and bis the slope of the line. Since the elevation is the explanatory variable, x, the coefficient of the x-term is the slope of the line. From the printout, this corresponds to the table value in the "Elevation" row, and "Coef" column. Therefore, b= -33.875 -33.875 The intercept is given by the value of the constant term. There is no variable, but the Minitab printout classifies this value as a "coefficient." (Note: This may or may not coincide with your previous experience with the terms "constant" and "coefficient," but it is mathematically correct for reasons that we will not explore in this tutorial.) The value in the "Constant" row and "Coef" column is 314.11. Therefore, a = 314.11 31411 Substitute these values into the least-square equation. y = a+ bx = 314.11 314.11 -33.875 -33.875 x Step 2 (b) For each 1000-foot increase in elevation, how many fewer frost-free days are predicted? We want to determine how many fewer frost-free days are predicted when the elevation increases by 1000 ft. Here, y is the number of frost-free days and the variable x is the elevation measured in thousands of feet. Therefore, each 1000 ft increase in elevation results in a 1 unit increase in x Recall that the slope of a least-squares line, y= a + bx, indicates how much y changes when x changes by 1 unit. In part (a), we determined the slope of the line is b= -33.875. This means that for each unit that x increases, the value of y decreases by -33.875 x units. Therefore, when the elevation increases by 1000 ft there are -33.875 * fewer frost-free days. Submit Skip (you cannot come back)