Answered step by step
Verified Expert Solution
Question
1 Approved Answer
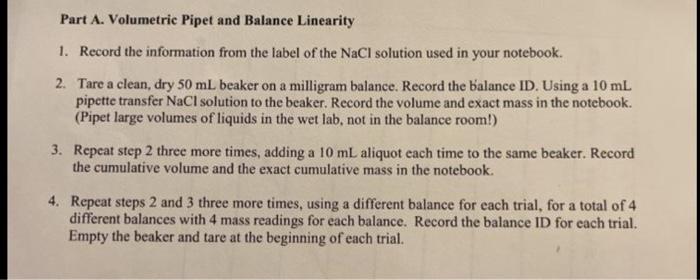
help please 1. In the space below, show how would you set up a table to record the information from part A? Part A. Volumetric


help please
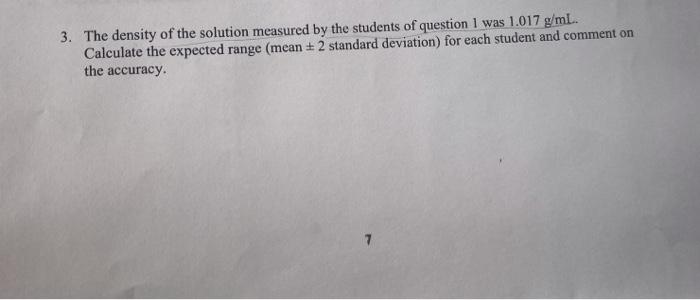
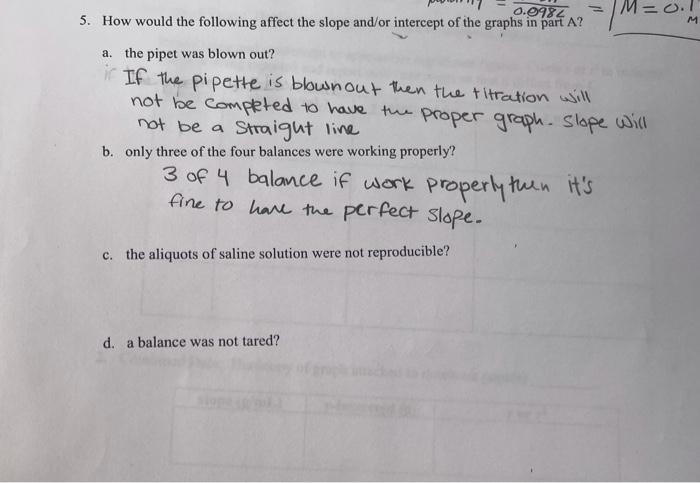
1. In the space below, show how would you set up a table to record the information from part A? Part A. Volumetric Pipet and Balance Linearity 1. Record the information from the label of the NaCl solution used in your notebook. 2. Tare a clean, dry 50 mL beaker on a milligram balance. Record the balance ID. Using a 10 mL pipette transfer NaCl solution to the beaker. Record the volume and exact mass in the notebook. (Pipet large volumes of liquids in the wet lab, not in the balance room! 3. Repeat step 2 three more times, adding a 10 mL aliquot each time to the same beaker. Record the cumulative volume and the exact cumulative mass in the notebook. 4. Repeat steps 2 and 3 three more times, using a different balance for each trial, for a total of 4 different balances with 4 mass readings for each balance. Record the balance ID for each trial. Empty the beaker and tare at the beginning of each trial. 3. The density of the solution measured by the students of question I was 1.017 g/mL. Calculate the expected range (mean +2 standard deviation) for each student and comment on the accuracy. 7 0.0987 5. How would the following affect the slope and/or intercept of the graphs in part A? 1M=0.11 a. the pipet was blown out? ir If the pipette is blown out then the titration will not be completed to have the proper graph slope will not be a b. only three of the four balances were working properly? 3 of 4 balance if work properly then it's fine to have the perfect slope. Straight line c. the aliquots of saline solution were not reproducible? d. a balance was not tared? 1. In the space below, show how would you set up a table to record the information from part A? Part A. Volumetric Pipet and Balance Linearity 1. Record the information from the label of the NaCl solution used in your notebook. 2. Tare a clean, dry 50 mL beaker on a milligram balance. Record the balance ID. Using a 10 mL pipette transfer NaCl solution to the beaker. Record the volume and exact mass in the notebook. (Pipet large volumes of liquids in the wet lab, not in the balance room! 3. Repeat step 2 three more times, adding a 10 mL aliquot each time to the same beaker. Record the cumulative volume and the exact cumulative mass in the notebook. 4. Repeat steps 2 and 3 three more times, using a different balance for each trial, for a total of 4 different balances with 4 mass readings for each balance. Record the balance ID for each trial. Empty the beaker and tare at the beginning of each trial. 3. The density of the solution measured by the students of question I was 1.017 g/mL. Calculate the expected range (mean +2 standard deviation) for each student and comment on the accuracy. 7 0.0987 5. How would the following affect the slope and/or intercept of the graphs in part A? 1M=0.11 a. the pipet was blown out? ir If the pipette is blown out then the titration will not be completed to have the proper graph slope will not be a b. only three of the four balances were working properly? 3 of 4 balance if work properly then it's fine to have the perfect slope. Straight line c. the aliquots of saline solution were not reproducible? d. a balance was not tared Step by Step Solution
There are 3 Steps involved in it
Step: 1

Get Instant Access to Expert-Tailored Solutions
See step-by-step solutions with expert insights and AI powered tools for academic success
Step: 2

Step: 3

Ace Your Homework with AI
Get the answers you need in no time with our AI-driven, step-by-step assistance
Get Started


