Answered step by step
Verified Expert Solution
Question
1 Approved Answer
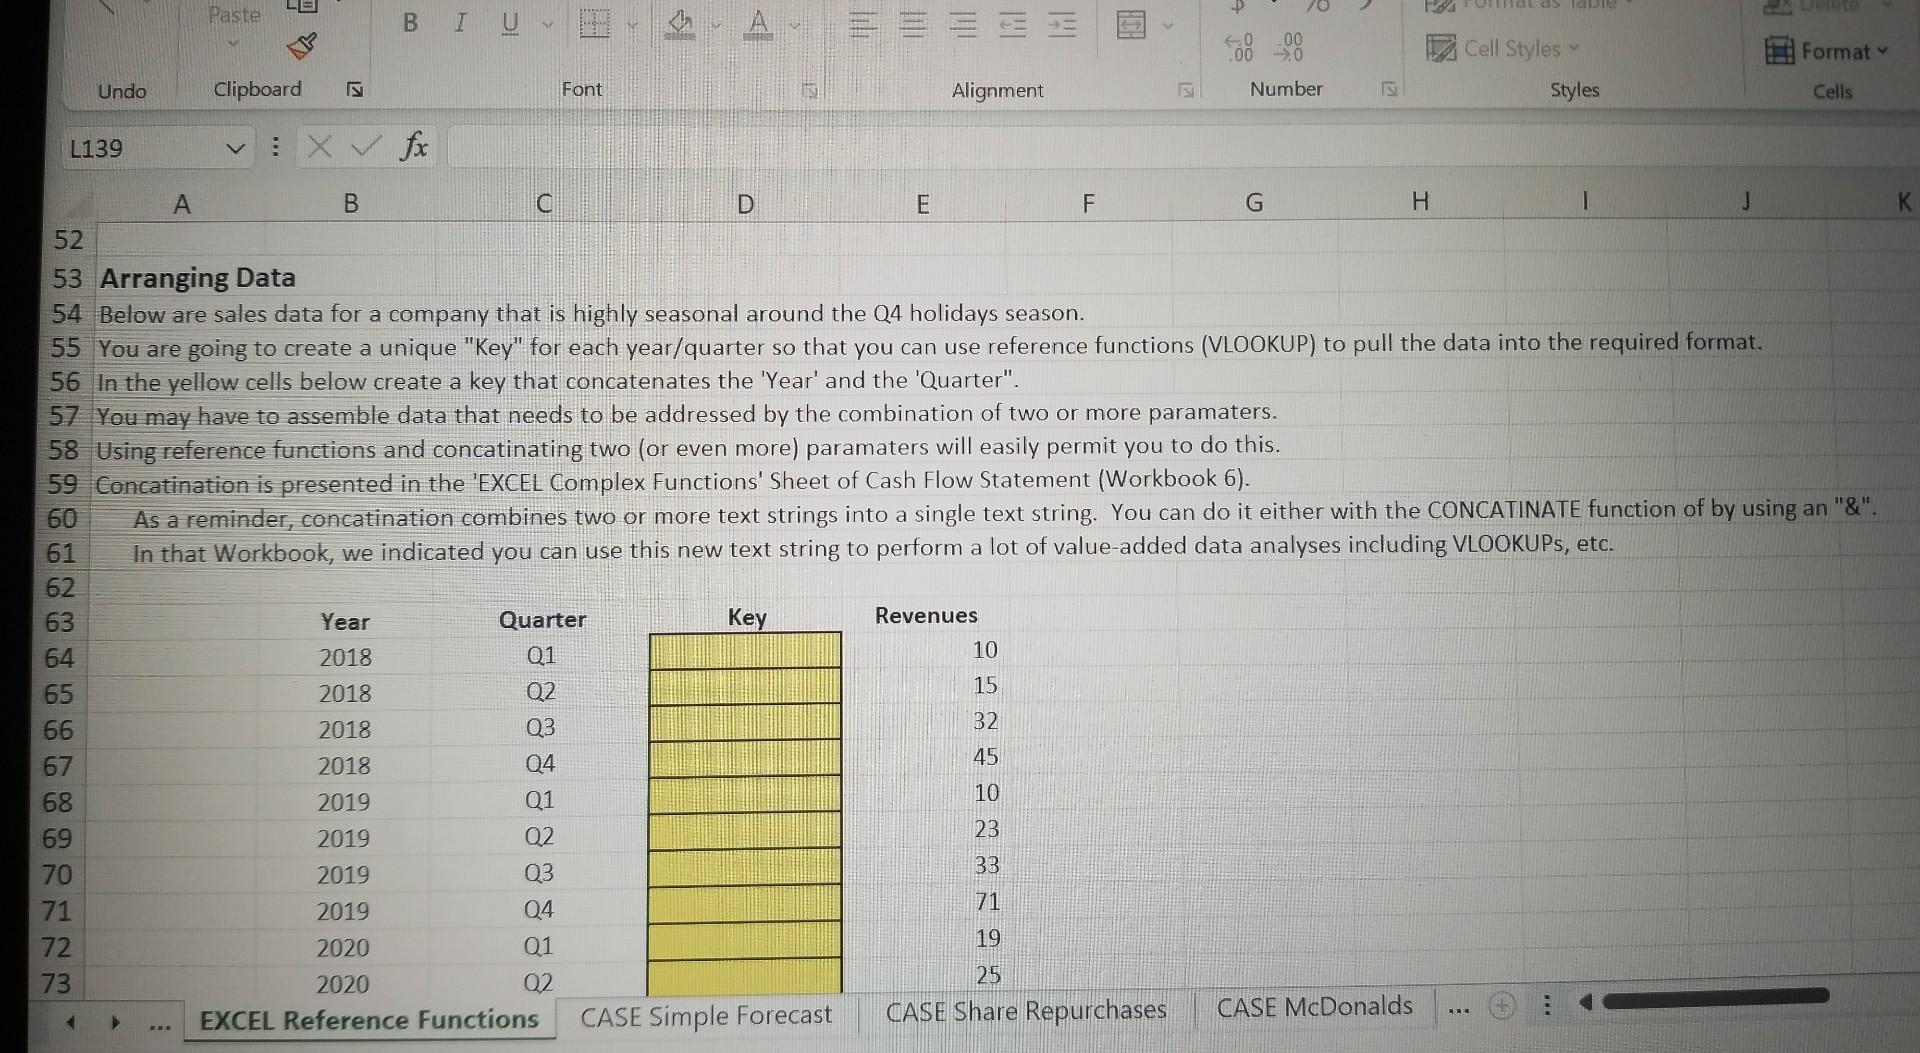
help please Arranging Data 4 Below are sales data for a company that is highly seasonal around the Q4 holidays season. 5 You are going
help please


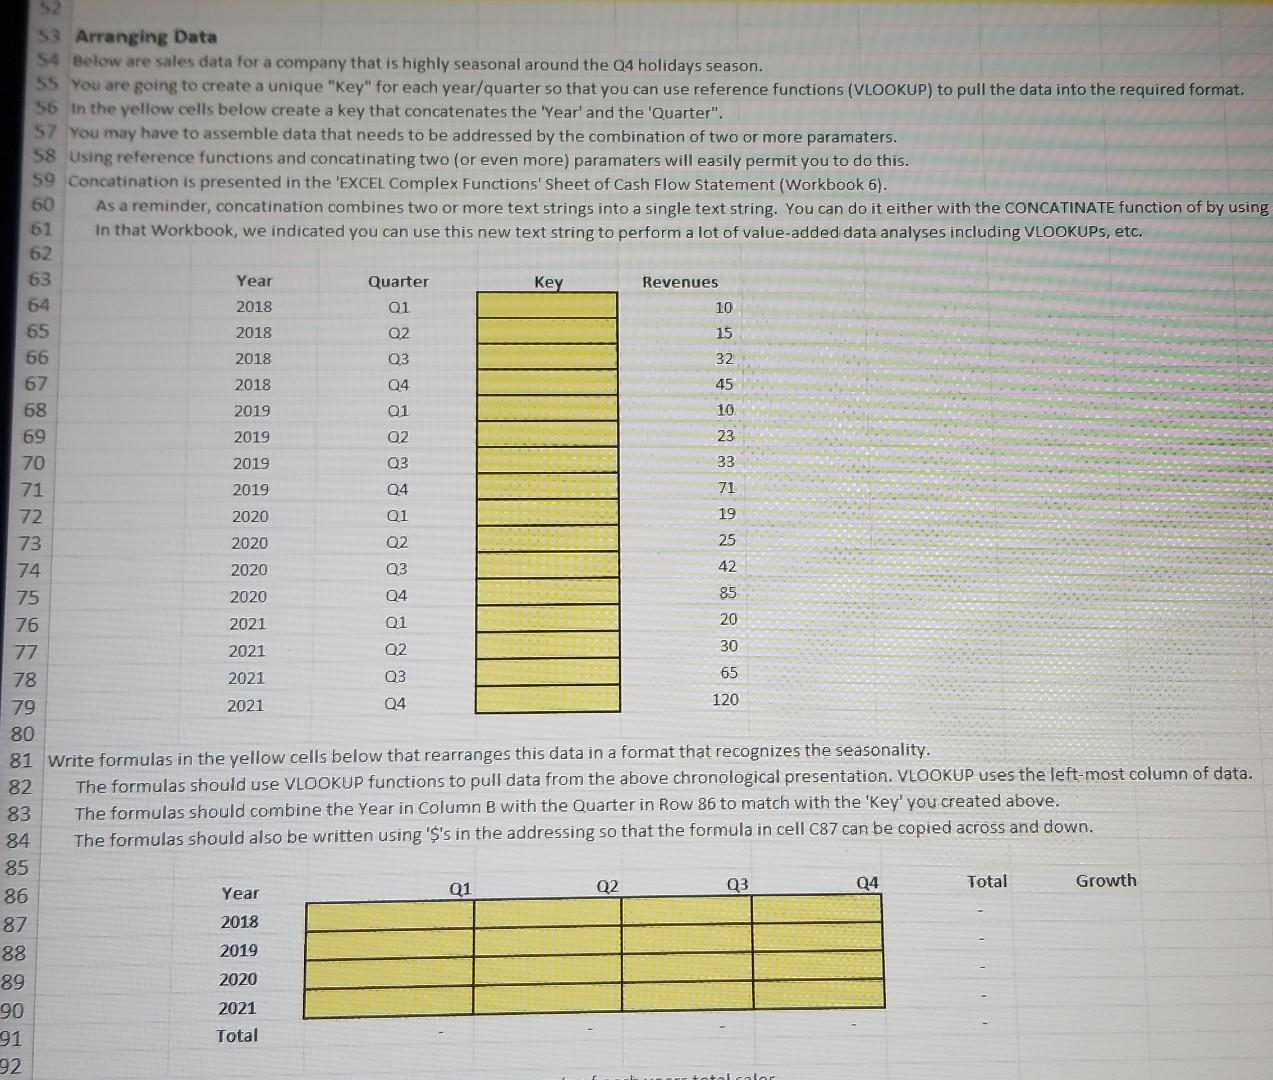
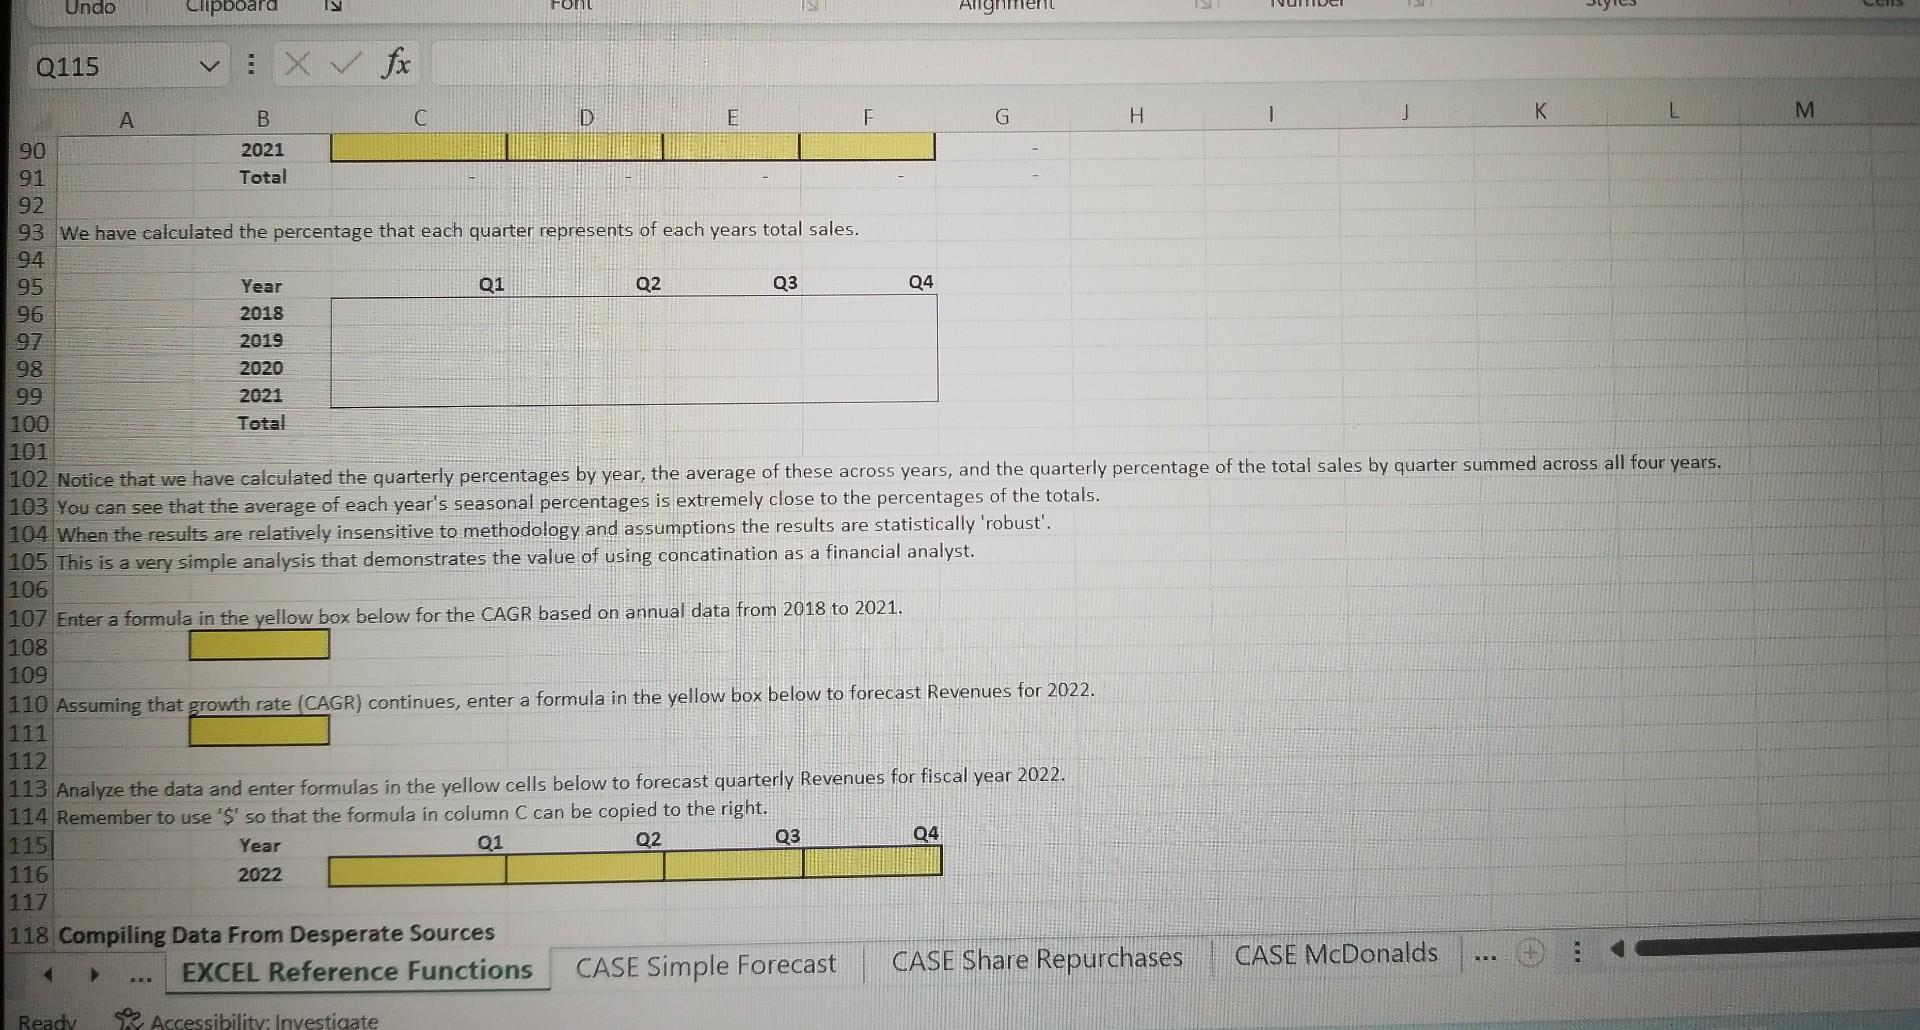
Arranging Data 4 Below are sales data for a company that is highly seasonal around the Q4 holidays season. 5 You are going to create a unique "Key" for each year/quarter so that you can use reference functions (VLOOKUP) to pull the data into the required format. 6 In the yellow cells below create a key that concatenates the 'Year' and the 'Quarter". 7 You may have to assemble data that needs to be addressed by the combination of two or moraters. 8 Using reference functions and concatinating two (or even more) paramaters will easily permit you to do this. 9 Concatination is presented in the 'EXCEL Complex Functions' Sheet of Cash Flow Statement (Workbook 6). As a reminder, concatination combines two or more text strings into a single text string. You can do it either with the CONCATINATE function of by using an "\&". In that Workbook, we indicated you can use this new text string to perform a lot of value-added data analyses including VLOOKUPs, etc. S3 Arranging Data 54 Below are sales data for a company that is highly seasonal around the Q4 holidays season. S5 You are going to create a unique "Key" for each year/quarter so that you can use reference functions (VLOOKUP) to pull the data into the required format. In the yellow cells below create a key that concatenates the 'Year' and the 'Quarter". You may have to assemble data that needs to be addressed by the combination of two or maramaters. Using reference functions and concatinating two (or even more) paramaters will easily permit you to do this. Concatination is presented in the 'EXCEL Complex Functions' Sheet of Cash Flow Statement (Workbook 6). As a reminder, concatination combines two or more text strings into a single text string. You can do it either with the CONCATINATE function of by using In that Workbook, we indicated you can use this new text string to perform a lot of value-added data analyses including VLOOKUP, etc. Write formulas in the yellow cells below that rearranges this data in a format that recognizes the seasonality. The formulas should use VLOOKUP functions to pull data from the above chronological presentation. VLOOKUP uses the left-most column of data. The formulas should combine the Year in Column B with the Quarter in Row 86 to match with the 'Key' you created above. The formulas should also be written using ''s in the addressing so that the formula in cell c87 can be copied across and down. We have calculated the percentage that each quarter represents of each years total sales. You can see that the average of each year's seasonal percentages is extremely close to the percentages of the totals. 04 When the results are relatively insensitive to methodology and assumptions the results are statistically 'robust'. This is a very simple analysis that demonstrates the value of using concatination as a financial analyst. Enter a formula in the vellow box below for the CAGR based on annual data from 2018 to 2021. Assuming that drowth rate (CAGR) continues, enter a formula in the yellow box below to forecast Revenues for 2022. Analyze the data and enter formulas in the yellow cells below to forecast quarterly Revenues for fiscal year 2022
Step by Step Solution
There are 3 Steps involved in it
Step: 1

Get Instant Access to Expert-Tailored Solutions
See step-by-step solutions with expert insights and AI powered tools for academic success
Step: 2

Step: 3

Ace Your Homework with AI
Get the answers you need in no time with our AI-driven, step-by-step assistance
Get Started


