

Answered step by step
Verified Expert Solution
Question
1 Approved Answer
help please Estimating Share Value Using the ROPI Model Following are forecasted sales, NOPAT, and NO for Texas Roadhouse for 2016 through 2019, Forecast the
help please 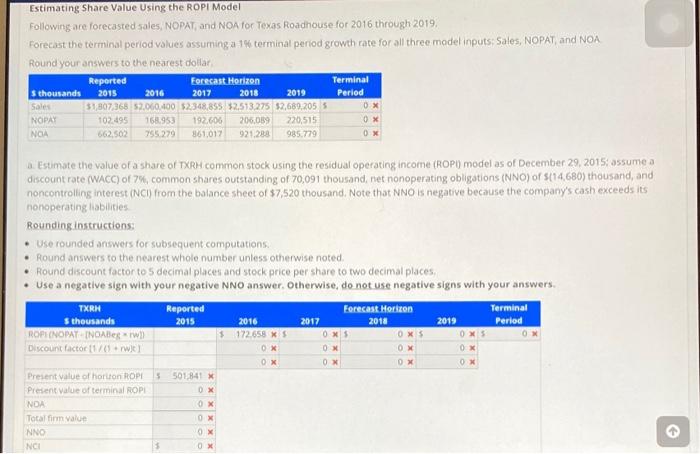
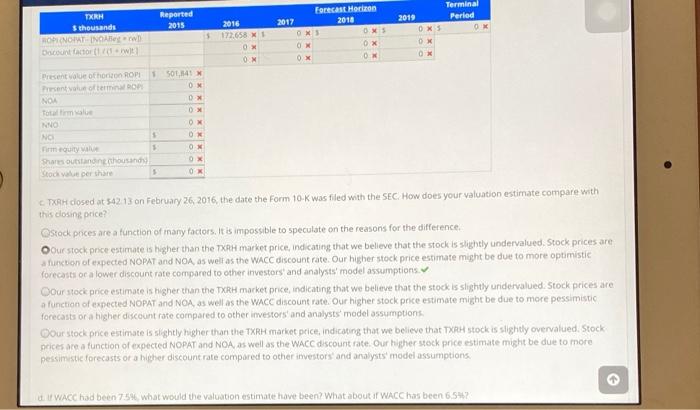
Estimating Share Value Using the ROPI Model Following are forecasted sales, NOPAT, and NO for Texas Roadhouse for 2016 through 2019, Forecast the terminal perlod values assuming a 14 terminal period growth rate for all three model inputs: Sales, NOPAT and NOA Round your answers to the nearest dollar Reported Forecast Horizon Terminal S thousands 2015 2016 2017 2018 2019 Period Sales 31,807 368 52.000.000 2,348,855 $2.513.275 32,689,205 5 OX NOPAY 102.95 168.953 192.600 206.059 220,515 OX NGA 755279 361,017 921.288 985.779 OX Estimate the value of a share of TXRH common stock using the residual operating income (ROPO) model as of December 29, 2015: assume a discount rate (WACC) of 7%, common shares outstanding of 70,091 thousand, net nonoperating obligations (NNO) of (14.680) thousand, and noncontrolling interest (NC) from the balance sheet of $7,520 thousand. Note that NNO is negative because the company's cash exceeds its nonoperating abilities Rounding instructions Use rounded answers for subsequent computations Round answers to the nearest whole number unless otherwise noted Round discount factor to 5 decimal places and stock price per Share to two decimal places Use a negative sign with your negative NNO answer. Otherwise, do not use negative signs with your answers. TXRH Reported Forecast Horizon Terminal sthousands 2015 2016 2017 2018 2019 Period ROPE (NOPAY INABAWI $ 172655 KS OX OX OX OX Discount factor (170) OX OX OX OX OX Present value of hartton ROPE 5 501,841 X Present value of terminal ROPE NDA Total firm value NNO NCI OX OX OX OX 0X OX OX Reported 2015 Terminal Period OK 2016 2017 TURM thousands ROP NORINO bant actor wit1 172.658 X 1 OX OM Forecast Horizon 2018 OX OX OX 2019 OX OX OX OM OX SOL.141 OX OX DX ON Present our ofhoo ROP Present out often NO Total time NO NO Pirm quity value Share outstandin thousand Stoca per share OX 1 ON OX 5 OX CTXH closed at 542.13 on February 26, 2016, the date the Form 10-K was filed with the SEC. How does your valuation estimate compare with this closing price? Ostock prices are a function of many factors. It is impossible to speculate on the reasons for the difference Our stock price estimate is higher than the TXR market price, indicating that we believe that the stock is slightly undervalued. Stock prices are function of expected NOPAT and NOA, as well as the WACC discount rate Our higher stock price estimate might be due to more optimistic forecasti oca lower discount rate compared to other investors and analysts model assumptions Oour stock price estimate is higher than the TXRH market price, indicating that we believe that the stock is slightly undervalued. Stock prices are a function of expected NOPAT and NOA, as well as the WACC discount rate. Our higher stock price estimate might be due to more pessimistic forecasts or a higher discount rate compared to other investors and analysts model assumptions Oour stock price estimate is slightly higher than the TXR market price, indicating that we believe that TXRH stock is slightly overvalued. Stock prices are a function of expected NOPAT and NOA, as well as the WACC discount rate. Our higher stock price estimate might be due to more pessimistic forecasts of a higher discount rate compared to other investors and analysts' model assumptions WACC had been 75% what would the valuation estimate have been? What about it WACC has been 6.542 Estimating Share Value Using the ROPI Model Following are forecasted sales, NOPAT, and NO for Texas Roadhouse for 2016 through 2019, Forecast the terminal perlod values assuming a 14 terminal period growth rate for all three model inputs: Sales, NOPAT and NOA Round your answers to the nearest dollar Reported Forecast Horizon Terminal S thousands 2015 2016 2017 2018 2019 Period Sales 31,807 368 52.000.000 2,348,855 $2.513.275 32,689,205 5 OX NOPAY 102.95 168.953 192.600 206.059 220,515 OX NGA 755279 361,017 921.288 985.779 OX Estimate the value of a share of TXRH common stock using the residual operating income (ROPO) model as of December 29, 2015: assume a discount rate (WACC) of 7%, common shares outstanding of 70,091 thousand, net nonoperating obligations (NNO) of (14.680) thousand, and noncontrolling interest (NC) from the balance sheet of $7,520 thousand. Note that NNO is negative because the company's cash exceeds its nonoperating abilities Rounding instructions Use rounded answers for subsequent computations Round answers to the nearest whole number unless otherwise noted Round discount factor to 5 decimal places and stock price per Share to two decimal places Use a negative sign with your negative NNO answer. Otherwise, do not use negative signs with your answers. TXRH Reported Forecast Horizon Terminal sthousands 2015 2016 2017 2018 2019 Period ROPE (NOPAY INABAWI $ 172655 KS OX OX OX OX Discount factor (170) OX OX OX OX OX Present value of hartton ROPE 5 501,841 X Present value of terminal ROPE NDA Total firm value NNO NCI OX OX OX OX 0X OX OX Reported 2015 Terminal Period OK 2016 2017 TURM thousands ROP NORINO bant actor wit1 172.658 X 1 OX OM Forecast Horizon 2018 OX OX OX 2019 OX OX OX OM OX SOL.141 OX OX DX ON Present our ofhoo ROP Present out often NO Total time NO NO Pirm quity value Share outstandin thousand Stoca per share OX 1 ON OX 5 OX CTXH closed at 542.13 on February 26, 2016, the date the Form 10-K was filed with the SEC. How does your valuation estimate compare with this closing price? Ostock prices are a function of many factors. It is impossible to speculate on the reasons for the difference Our stock price estimate is higher than the TXR market price, indicating that we believe that the stock is slightly undervalued. Stock prices are function of expected NOPAT and NOA, as well as the WACC discount rate Our higher stock price estimate might be due to more optimistic forecasti oca lower discount rate compared to other investors and analysts model assumptions Oour stock price estimate is higher than the TXRH market price, indicating that we believe that the stock is slightly undervalued. Stock prices are a function of expected NOPAT and NOA, as well as the WACC discount rate. Our higher stock price estimate might be due to more pessimistic forecasts or a higher discount rate compared to other investors and analysts model assumptions Oour stock price estimate is slightly higher than the TXR market price, indicating that we believe that TXRH stock is slightly overvalued. Stock prices are a function of expected NOPAT and NOA, as well as the WACC discount rate. Our higher stock price estimate might be due to more pessimistic forecasts of a higher discount rate compared to other investors and analysts' model assumptions WACC had been 75% what would the valuation estimate have been? What about it WACC has been 6.542 Step by Step Solution
There are 3 Steps involved in it
Step: 1

Get Instant Access to Expert-Tailored Solutions
See step-by-step solutions with expert insights and AI powered tools for academic success
Step: 2

Step: 3
Ace Your Homework with AI
Get the answers you need in no time with our AI-driven, step-by-step assistance
Get Started
Investments Unlimited A Novel About DevOps Security Audit Compliance And Thriving In The Digital Age
Authors: Helen Beal, Bill Bensing, Jason Cox, Michael Edenzon, John Willis
1st Edition
1950508536, 978-1950508532