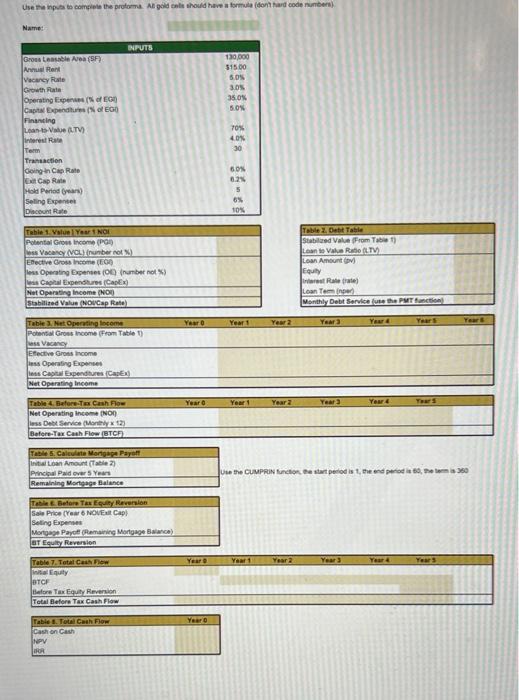
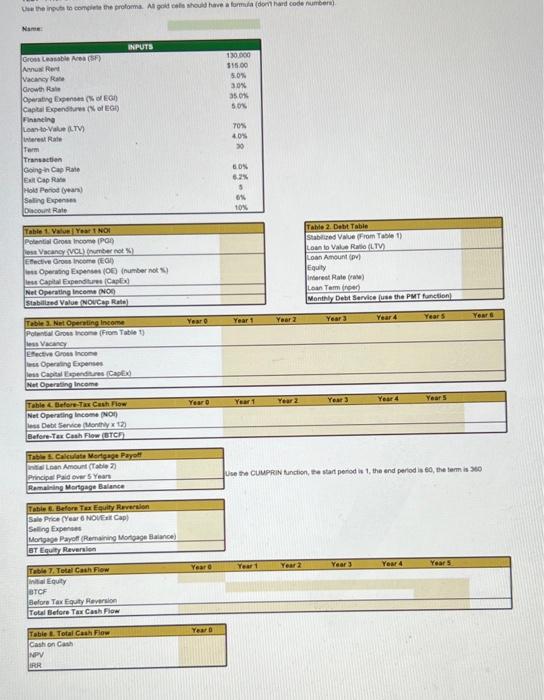
Use the inputs to complete the proforma. Al gold cells should have a formula (don't hard code numbers) Name: INPUTS 130,000 Gross Leasable Area (SF) Annual Rent $15.00 Vacancy Rate 5.0% Growth Rate 3.0% Operating Expenses (% of EG 35.0% 5.0% Capital Expenditures (% of EG Financing Lean-to-Value (TV) interest Rate Term Transaction Going in Cap Rate Exit Cap Rate Hold Period (years) Seling Expenses Discount Rate Table 1. Value Year 1 NOI Potential Gross Income (PGI) less Vacancy (VCL) (number not %) Effective Gross Income (EG) less Operating Expenses (0) (number not %) less Capital Expenditures (CapEx) Net Operating Income (NO) Stabilized Value (NOVCap Rate) Table 3. Net Operating Income Potential Gross Income (From Table 1) ess Vacancy Effective Gross Income less Operating Expenses less Capital Expenditures (CapEx) Net Operating Income Table 4. Before-Tax Cash Flow Net Operating Income (NO) less Debt Service (Monthlyx 12) Before-Tax Cash Flow (BTCF) Table 5. Calculate Mortgage Payoff Initial Loan Amount (Table 2) Principal Paid over 5 Years Remaining Mortgage Balance Table E Before Tax Equity Reversion Sale Price (Year 6 NOVE Cap Selling Expenses Mortgage Payoff (Remaining Mortgage Balance) BT Equity Reversion Table 7. Total Cash Flow initial Equity BTCF Before Tax Equity Reversion Total Before Tax Cash Flow Table 8. Total Cash Flow Cash on Cash NPV FOR Year 0 Year 0 Year Year D 70% 4.0% 30 60% 6.2% 5 6% 10% Table 2. Debt Table Stabilized Value (From Table 1) Loan to Value Rabo (LTV) Loan Amount (pv) Equity Interest Rate (rale) Loan Tem (nper) Monthly Debt Service (use the PMT function) Year 1 Year 2 Year 3 Year & Year S Year 1 Year 2 Year 3 Year 4 Year S Use the CUMPRIN function, the start period Year 1 Year 2 Year 3 Year 4 Year S elemis 350 Year's Use the inputs to complete the proforma. Al gold cells should have a formula (dont hard code numbers) INPUTS 130.000 Gross Leasable Area (SF) Annual Rent $15.00 Vacancy Rate 5.0% Growth Rale 30% Operating Expenses (% of EG) 35.0% 50% Capital Expenditures (% of EG Financing Loan-to-Value (TV) 70% Interest Rate 4.0% Term 30 Transaction 6.0% Going in Cap Rate Exit Cap Rate 6,2% 5 Hold Period (years) Selling Expenses Discount Rate 0% 10% Table 1. Value Year 1 NOI Table 2. Debt Table Stabilized Value (From Table 1) Potential Gross Income (PG) less Vacancy (VCL) (number not %) Loan to Value Ratio (LTV) Loan Amount (pv) Effective Gross Income (EC) Jess Operating Expenses (OE) (number not %) Equity Interest Rate (rate) less Capital Expenditures (Caplx) Net Operating Income (NO) Stabilized Value (NOVCap Rate) Loan Term (rper) Monthly Debt Service (use the PMT function) Table 3. Net Operating Income Year 1 Year 2 Year 3 Year 4 Year S Potential Gross Income (From Table 1) less Vacancy Effective Gross Income less Operating Expenses less Capital Expenditures (CapEx) Net Operating Income Year 1 Year 2 Year 3 Yeur 4 Year 5 Table 4. Before-Tax Cash Flow Net Operating Income (NO) less Debt Service (Monthly x 12) Before-Tex Cash Flow (BTCF) Table 5. Calculate Mortgage Payoff nitial Loan Amount (Table 2) Principal Paid over 5 Years Use the CUMPRIN function, the start period is 1, the end period is 60, the term is 360 Remaining Mortgage Balance Table 6. Before Tex Equity Reversion Sale Price (Year 6 NOVEx Cap) Selling Expenses Mortgage Payoff (Remaining Mortgage Balance) BT Equity Reversion Table 7, Total Cash Flow Year 1 Year 2 Year 3 Year 4 Year 5 initial Equity BTCF Before Tax Equity Reversion Total Before Tax Cash Flow Table 8. Total Cash Flow Cash on Cash NPV IRR Year O Year O Year Year D Year


