Answered step by step
Verified Expert Solution
Question
1 Approved Answer
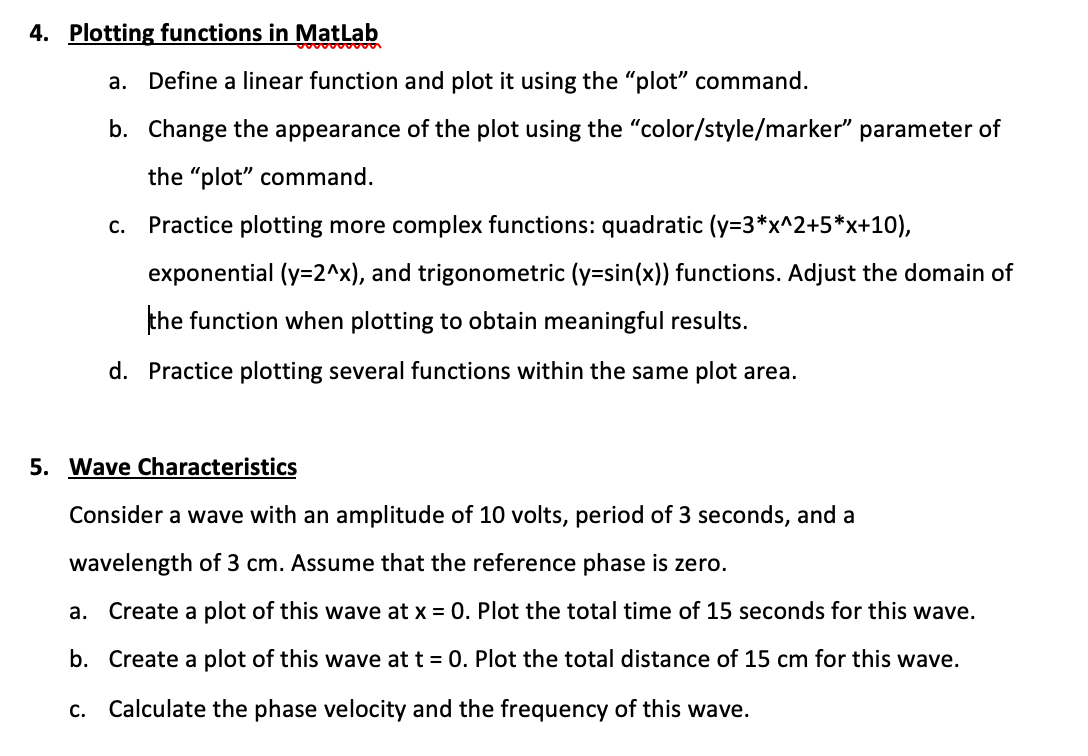
help plz , matlab vooooooooo 4. Plotting functions in Matlab a. Define a linear function and plot it using the plot command. b. Change the
help plz , matlab
vooooooooo 4. Plotting functions in Matlab a. Define a linear function and plot it using the "plot" command. b. Change the appearance of the plot using the "color/style/marker" parameter of the "plot" command. Practice plotting more complex functions: quadratic (y=3*x^2+5*x+10), exponential (y=2^x), and trigonometric (y=sin(x)) functions. Adjust the domain of the function when plotting to obtain meaningful results. d. Practice plotting several functions within the same plot area. C. 5. Wave Characteristics Consider a wave with an amplitude of 10 volts, period of 3 seconds, and a wavelength of 3 cm. Assume that the reference phase is zero. a. Create a plot of this wave at x = 0. Plot the total time of 15 seconds for this wave. b. Create a plot of this wave at t = 0. Plot the total distance of 15 cm for this wave. C. Calculate the phase velocity and the frequency of this waveStep by Step Solution
There are 3 Steps involved in it
Step: 1
Get Instant Access to Expert-Tailored Solutions
See step-by-step solutions with expert insights and AI powered tools for academic success
Step: 2
Step: 3
Ace Your Homework with AI
Get the answers you need in no time with our AI-driven, step-by-step assistance
Get Started