Answered step by step
Verified Expert Solution
Link Copied!

Question

1 Approved Answer

help thanks A study was conducted at the end of an introductory statistics course to investigate the relationship between x = skipping class and y

help thanks
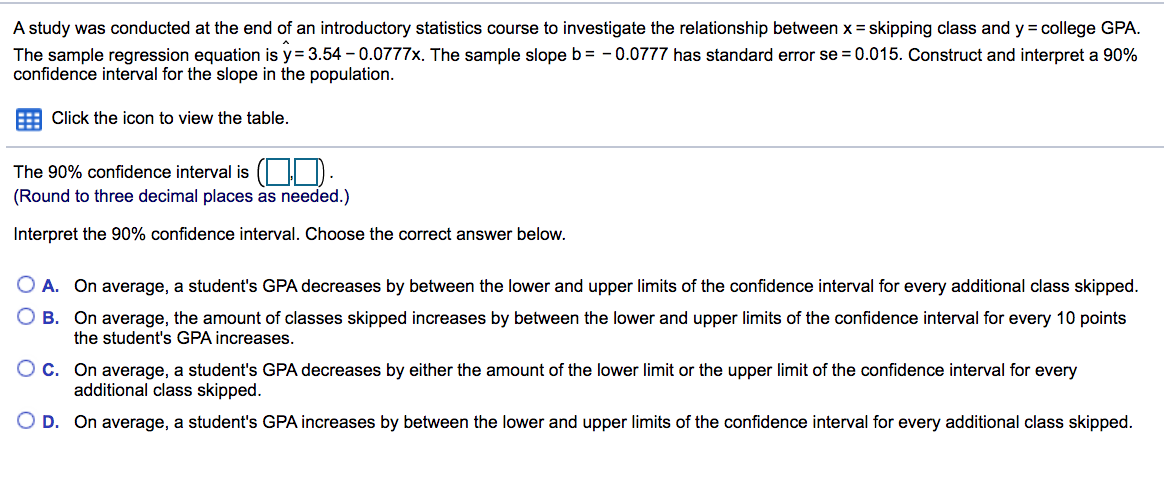
image text in transcribed
A study was conducted at the end of an introductory statistics course to investigate the relationship between x = skipping class and y = college GPA. The sample regression equation is y = 3.54 - 0.0777x. The sample slope b = - 0.0777 has standard error se = 0.015. Construct and interpret a 90% confidence interval for the slope in the population. Click the icon to view the table. The 90% confidence interval is (OO) (Round to three decimal places as needed.) Interpret the 90% confidence interval. Choose the correct answer below. O A. On average, a student's GPA decreases by between the lower and upper limits of the confidence interval for every additional class skipped. O B. On average, the amount of classes skipped increases by between the lower and upper limits of the confidence interval for every 10 points the student's GPA increases. O C. On average, a student's GPA decreases by either the amount of the lower limit or the upper limit of the confidence interval for every additional class skipped. O D. On average, a student's GPA increases by between the lower and upper limits of the confidence interval for every additional class skipped

Step by Step Solution

There are 3 Steps involved in it

Step: 1

blur-text-image

Get Instant Access to Expert-Tailored Solutions

See step-by-step solutions with expert insights and AI powered tools for academic success

Step: 2

blur-text-image

Step: 3

blur-text-image

Ace Your Homework with AI

Get the answers you need in no time with our AI-driven, step-by-step assistance

Get Started

Recommended Textbook for

Making Hard Decisions with decision tools

Authors: Robert Clemen, Terence Reilly

3rd edition

538797576, 978-0538797573

More Books

Students also viewed these Mathematics questions