

Answered step by step
Verified Expert Solution
Question
1 Approved Answer
help! The table below contains data on Fincorp Inc. The balance sheet items correspond to values at year-end 2018 and 2019, while the income statement
help! 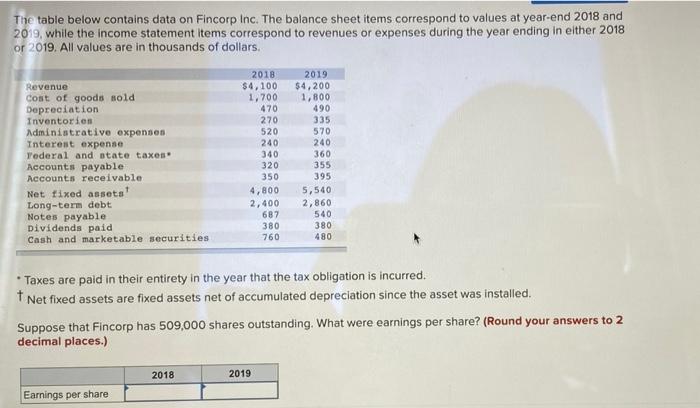
The table below contains data on Fincorp Inc. The balance sheet items correspond to values at year-end 2018 and 2019, while the income statement items correspond to revenues or expenses during the year ending in either 2018 or 2019. All values are in thousands of dollars. Revenue Cont of goods sold Depreciation Inventorien Administrative expenses Interest expense Tederal and state taxes Accounts payable Accounts receivable Net fixed assets Long-term debt Notes payable Dividends paid Cash and marketable securities 2018 $4,100 1,700 470 270 520 240 340 320 350 4,800 2,400 687 380 760 2019 $4,200 1,800 490 335 570 240 360 355 395 5,540 2,860 540 380 480 Taxes are paid in their entirety in the year that the tax obligation is incurred. * Net fixed assets are fixed assets net of accumulated depreciation since the asset was installed, Suppose that Fincorp has 509,000 shares outstanding. What were earnings per share? (Round your answers to 2 decimal places.) 2018 2019 Earnings per share Step by Step Solution
There are 3 Steps involved in it
Step: 1

Get Instant Access to Expert-Tailored Solutions
See step-by-step solutions with expert insights and AI powered tools for academic success
Step: 2

Step: 3
Ace Your Homework with AI
Get the answers you need in no time with our AI-driven, step-by-step assistance
Get Started
Auditing Assurance Services And Ethics In Australia
Authors: Alvin Arens
10th Edition
1488609136, 978-1488609138